104 Customer Service Statistics for 2026, Traced to the Source
104 customer service statistics, each traced to its source, plus an audit of the 10 most-quoted claims: only 2 hold up. Workforce, complaints, AI and cost.
On this page
- Key Takeaways
- Which customer service statistics actually hold up?
- Who works in customer service?
- How satisfied are customers with customer service?
- How many customers complain, and about what?
- Which channels do customers use for service?
- How fast do companies respond to customers?
- How is AI changing customer service?
- Does good customer service pay off?
- What does customer service cost?
- Methodology and Sources
- Sources
Most customer service statistics online are copies of copies. We followed the ten numbers repeated most often, by Google’s AI answers and by help desk vendors’ own statistics pages, back to the studies they came from, and only two survived intact. This page starts with that audit, then gives 104 statistics on customer service in 2026, each traced to the organisation that produced it: who does the work and what they earn, how satisfied customers are, how many complain and about what, which channels they use, how fast companies answer, what AI is changing, whether good service pays, and what it costs.
Our sources are government statistics offices and regulators, national satisfaction indexes, peer-reviewed or clearly described surveys, and companies publishing data from their own platforms or surveys, which we label as such. Two sections use Convot’s own studies of app store reviews and help desk prices.
Updated October 2026. We check every link monthly and replace numbers when a newer edition is published.
Key Takeaways
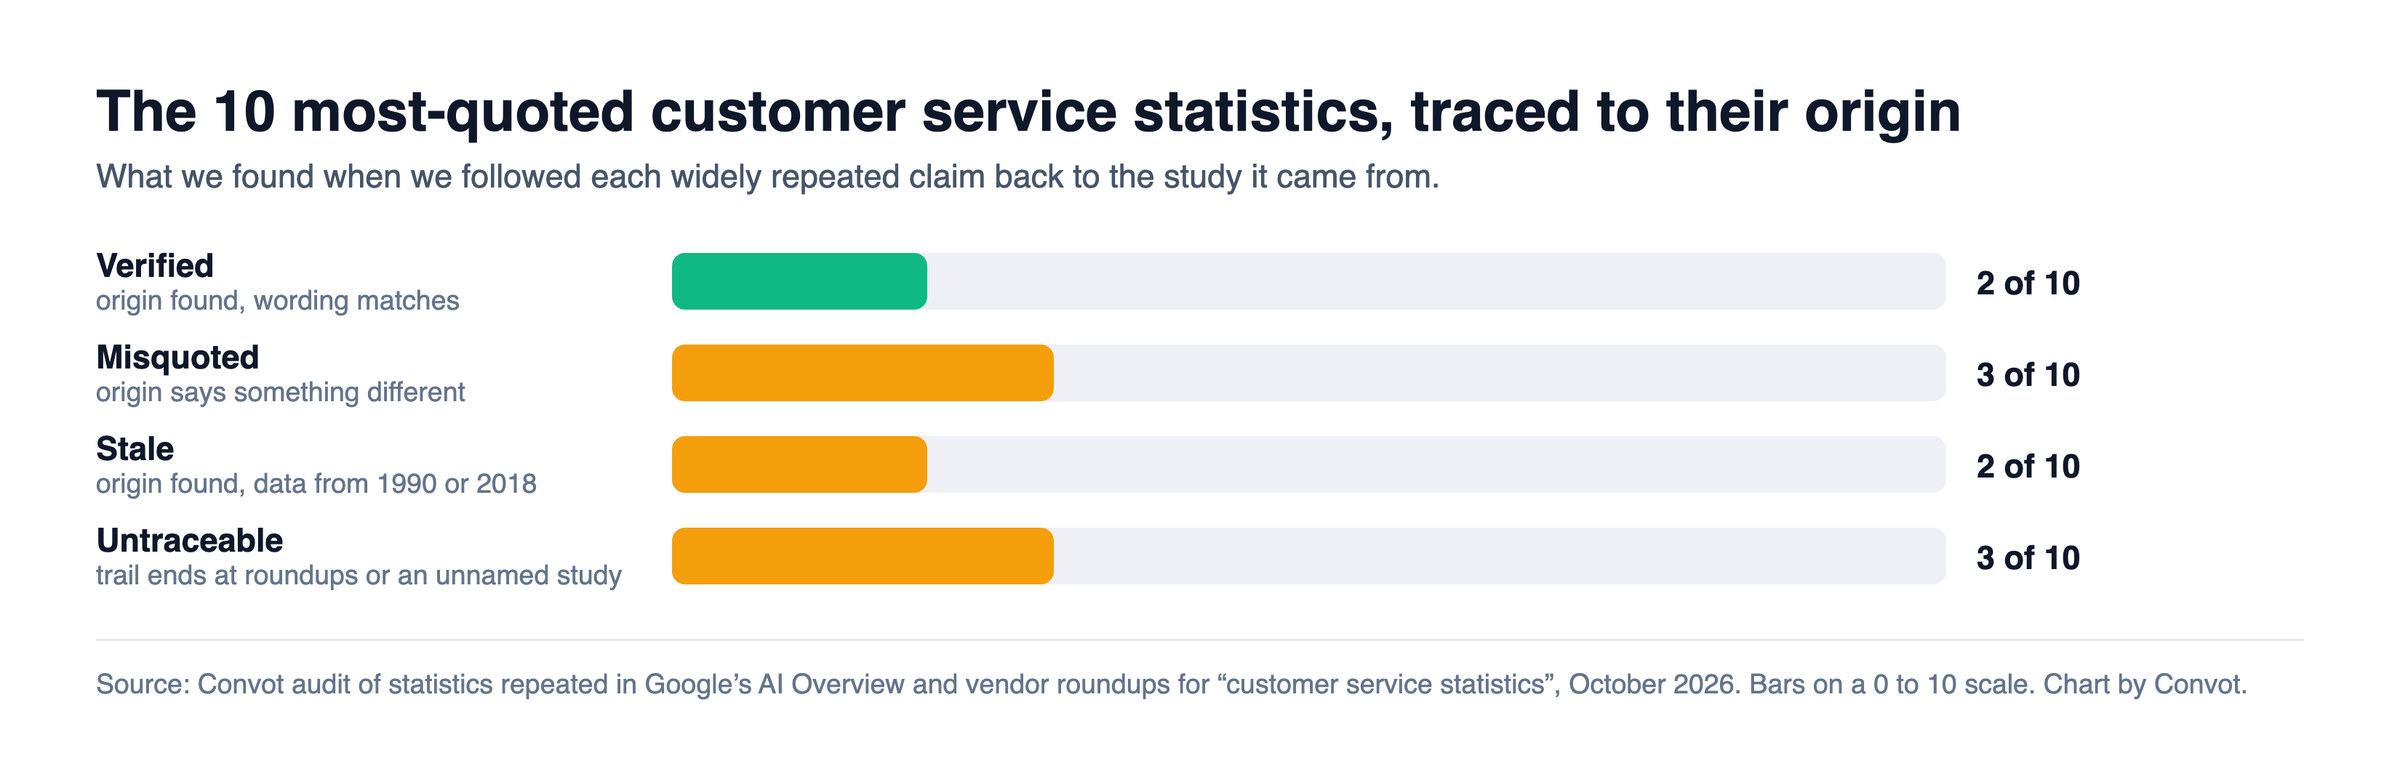
- Of the 10 most-quoted customer service statistics, only 2 trace back intact to their original study; 3 are misquoted, 2 are stale and 3 cannot be traced (Convot audit, Oct 2026).
- 52% of US consumers stopped using or buying from a brand after a bad experience with its products or services, and 29% after poor customer experience (PwC, 2025 Customer Experience Survey, Sep 2025).
- The US has 2,666,000 customer service representative jobs, and the number is projected to fall 5% by 2035 (U.S. Bureau of Labor Statistics, Occupational Outlook Handbook, Aug 2026).
- The US Consumer Financial Protection Bureau received 6,635,400 complaints in 2025, more than double the year before (CFPB, Consumer Response Annual Report, Mar 2026).
- People reported losing $15.9 billion to fraud to the FTC in 2025, across 3 million reports (Federal Trade Commission, Mar 2026).
- UK customer satisfaction stands at 78.3 out of 100, up 1 point in a year (Institute of Customer Service, UKCSI, Jul 2026).
- Phone still carries 78% of UK mobile customers’ contacts with their provider (Ofcom, Comparing Customer Service, May 2025).
- Only 14% of customer service issues are fully resolved in self-service (Gartner, Aug 2024).
- 87% of customers say companies using generative AI for service must offer a way to reach a human agent (Gartner, Aug 2026).
- AI agent adoption in customer service organisations rose from 39% in 2025 to 66% in 2026, in Salesforce’s survey of 3,075 service professionals (Salesforce, May 2026).
- Only 15% of consumers report a seamless handoff from an AI agent to a human (Twilio, Nov 2025).
- The published price of one AI-handled support conversation ranges from $0.05 to $0.99 across nine help desks (Convot help desk pricing index, Oct 2026).
Which customer service statistics actually hold up?
Most of the numbers repeated on statistics pages either change meaning on the way or have no study behind them at all. Before quoting a customer service statistic, find the study, the date and who was asked.
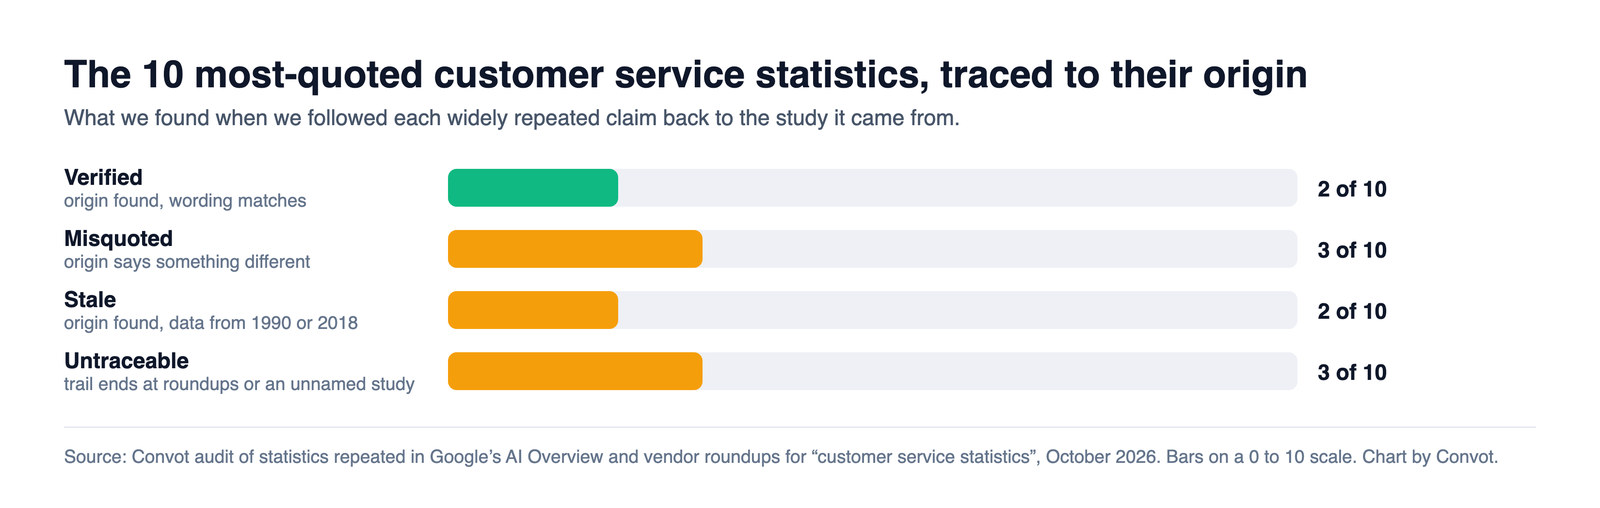 Figure 1: Eight of the ten numbers that dominate search results for customer service statistics are wrong, old or unsourced, so the figure you saw quoted last week may not say what you think. Source: Convot audit, Oct 2026. Chart by Convot.
| Claim as usually quoted | What the origin says | Verdict |
|---|---|---|
| 32% leave a brand they love after one bad experience | PwC survey of 15,000 people in 12 countries, 2017 to 2018 | Stale |
| Businesses lose $3.7 trillion a year to bad experiences | Qualtrics models sales “at risk”, now about $3 trillion | Misquoted |
| 89% buy again after good service | Salesforce printed 91% in 2020; no edition we could read prints 89% | Untraceable |
| 3 in 4 consumers spend more after a good experience | ”Zendesk Benchmark data”, no date or sample | Untraceable |
| 88% expect faster responses than a year ago | Zendesk CX Trends 2026, 6,182 consumers | Verified |
| 80% prefer a human representative | Zendesk line about agents handling “everything they need” | Misquoted |
| 78% prefer self-service | What service leaders believe about customers | Misquoted |
| Customer-obsessed firms grow revenue 41% faster | Forrester, 2024 US CX Index | Verified |
| 5% more retention lifts profit 25% to 95% | Bain, 1990; “25% to 95%” first appears in a 2014 blog | Stale |
| New customers cost 5 to 25 times more than keeping one | HBR 2014 blog naming no study | Untraceable |
Which of the famous numbers are verified?
Two of the ten match their source, with caveats.
- 88% of customers expect faster response times than they did a year ago, in Zendesk’s survey of 6,182 consumers in 22 countries; it measures expectation, not actual speed (Zendesk, CX Trends 2026, Nov 2025).
- Customer-obsessed organisations reported 41% faster revenue growth, 49% faster profit growth and 51% better retention; the figures are self-reported and only 3% of companies qualified (Forrester, Jun 2024).
Which are misquoted or stale?
The meaning shifts as the numbers are retold.
- The “32% leave after one bad experience” figure pools 12 countries; in the same PwC report the US figure is 17% (PwC, Experience is everything, 2018).
- Qualtrics now estimates organisations are putting nearly $3 trillion of sales at risk in 2026, a modelled exposure, not money lost (Qualtrics XM Institute, Nov 2025).
- The earlier Qualtrics edition put the figure at $4.7 trillion of sales at risk, which is why both numbers still circulate (Qualtrics XM Institute, Sep 2021).
- HubSpot’s 78% comes from service leaders: “According to service leaders, an astonishing 78% of customers prefer to solve their issues independently” (HubSpot, State of Service 2024, Oct 2024).
- Bain’s original 1990 finding was that companies can boost profits by almost 100% by retaining 5% more customers, measured on service firms rather than across industries (Bain & Company, 1990).
Which have no traceable source?
Three trails end without a study.
- Salesforce’s 2020 survey of 12,000 consumers found 91% more likely to buy again after a great service experience, not the 89% usually quoted (Salesforce, State of the Connected Customer, 2020).
- Zendesk attributes “3 in 4 consumers will spend more” and its 80% agent-expectation line to “Zendesk Benchmark data”, with no date or sample (Zendesk, Jan 2026).
- The “5 to 25 times” acquisition cost appears in a 2014 HBR article that says “Depending on which study you believe” and names none (Harvard Business Review, Oct 2014).
Who works in customer service?
Customer service is one of the largest jobs in the US, and one of the few the government expects to shrink. The work is concentrated in insurance, finance and outsourced call centers.
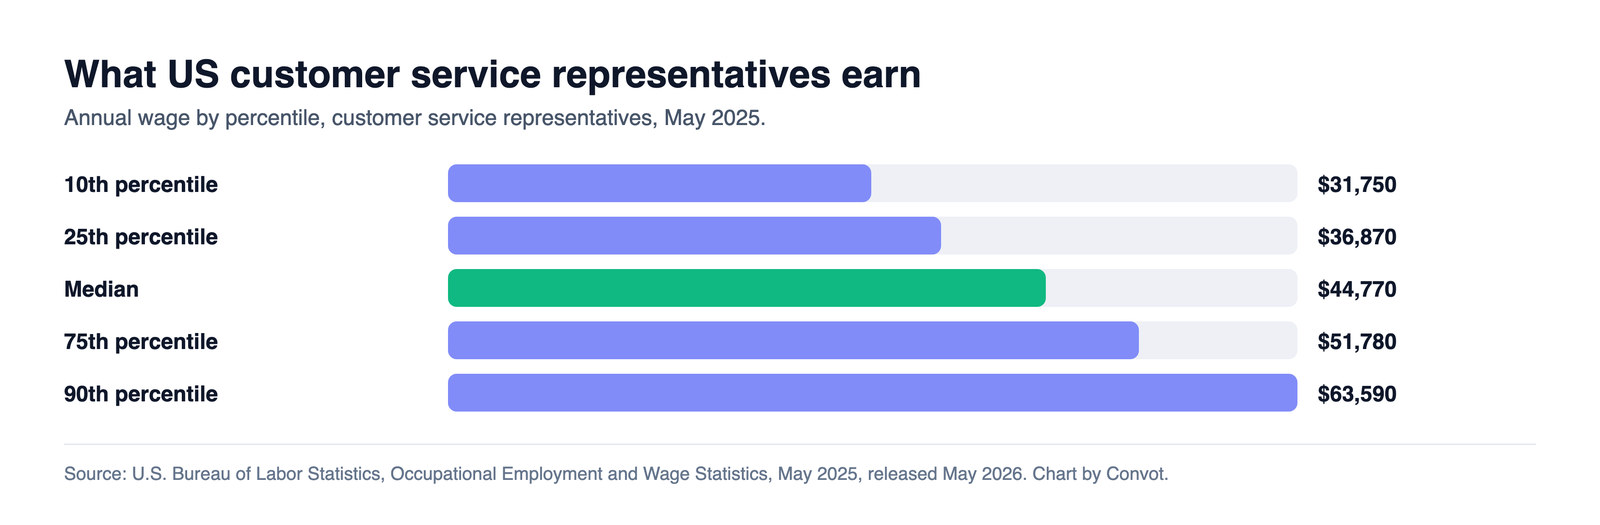 Figure 2: Most customer service representatives earn between about $37,000 and $52,000 a year, so every hour of agent time costs a company roughly $20 to $25 before overheads. Source: U.S. Bureau of Labor Statistics, OEWS, May 2025 data released May 2026. Chart by Convot.
How many people work in customer service, and is it growing?
The occupation is large but declining.
- The median customer service representative earned $44,770 a year, or $21.53 an hour, in May 2025 (U.S. Bureau of Labor Statistics, Occupational Outlook Handbook, Aug 2026).
- BLS projects about 289,500 openings a year for customer service representatives despite the decline, all from replacing workers who leave (U.S. Bureau of Labor Statistics, Occupational Outlook Handbook, Aug 2026).
- The OEWS survey counts 2,595,750 customer service representatives in May 2025, with a mean wage of $46,590 a year or $22.40 an hour (U.S. Bureau of Labor Statistics, OEWS, May 2026).
Where do customer service representatives work?
Insurance and outsourcing employ the most.
- Insurance carriers and related activities employ 292,830 customer service representatives, the largest industry among those BLS reports for the occupation (U.S. Bureau of Labor Statistics, OEWS, May 2026).
- Business support services, the group that includes telephone call centers, employs 215,440, at a mean wage of $39,160 (U.S. Bureau of Labor Statistics, OEWS, May 2026).
- Texas employs the most customer service representatives of any state, 337,170, followed by Florida with 228,000 and California with 176,850 (U.S. Bureau of Labor Statistics, OEWS, May 2026).
- Utilities pay customer service representatives a mean $61,620 a year, the highest among the large-employment industries BLS reports for the occupation (U.S. Bureau of Labor Statistics, OEWS, May 2026).
How is the agent role changing?
Service leaders are redesigning the job rather than cutting it.
- Only 20% of customer service leaders have reduced agent staffing because of AI, and 55% report stable staffing while handling higher volumes (Gartner, Dec 2025).
- 85% of service and support leaders are expanding human agents’ responsibilities (Gartner, Apr 2026).
- 31% of service leaders have made or plan layoffs through early 2027, while 63% are reducing headcount gradually through attrition (Gartner, Apr 2026).
- Nearly 80% of service leaders plan to move agents into new roles, and 58% will upskill agents into knowledge management specialists (Gartner, Feb 2026).
How satisfied are customers with customer service?
Satisfaction is high and creeping up in the UK, but customers are much less happy once something goes wrong. Complaint handling is where scores drop.
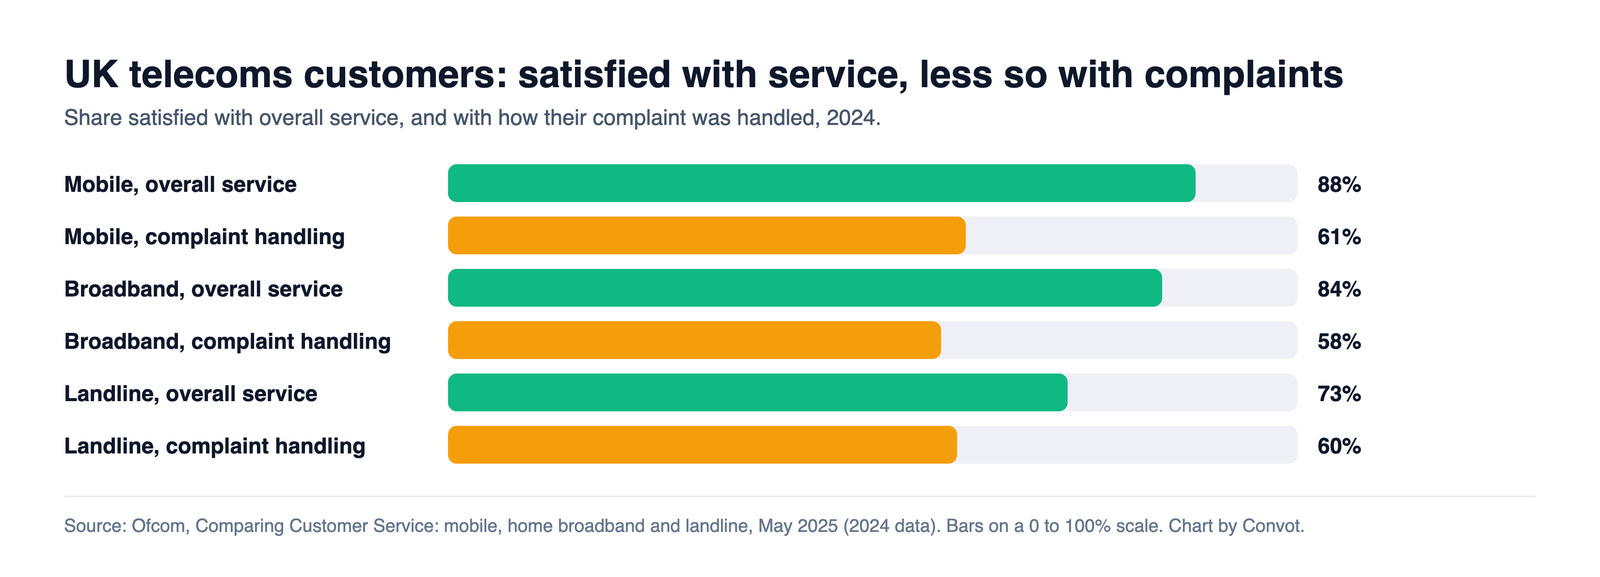 Figure 3: The gap between satisfaction with the service and satisfaction with complaint handling is more than 20 points for mobile and broadband, which is where support teams win or lose customers. Source: Ofcom, Comparing Customer Service, May 2025. Chart by Convot.
What does the UK satisfaction index show?
The UKCSI is based on 59,500 responses about 277 organisations in 13 sectors.
- Banks and building societies scored 82.0, the highest-rated UK sector for the first time (Institute of Customer Service, UKCSI, Jul 2026).
- 83.5% of UK customer experiences were rated right first time, up 1.4 points in a year (Institute of Customer Service, Jul 2026).
- 14.8% of UK customers had a problem or bad experience with an organisation, up 0.4 points on July 2025 (Institute of Customer Service, Jul 2026).
- Globally, 11% of consumer experiences are bad ones, in Qualtrics’ survey of more than 20,000 consumers in 14 countries (Qualtrics XM Institute, Nov 2025).
How well are complaints resolved?
First-contact resolution is still the exception in telecoms.
- Half of UK mobile complaints, 50%, were completely resolved on first contact in 2024, against 48% for landline and 44% for broadband (Ofcom, Comparing Customer Service, May 2025).
- 14% of UK mobile customers and 23% of broadband customers said they had a reason to complain in 2024 (Ofcom, Comparing Customer Service, May 2025).
How many customers complain, and about what?
Complaints to regulators are at record levels in the US, driven mostly by credit reporting and fraud. In the UK, ombudsman complaints are falling as claims firms pull back.
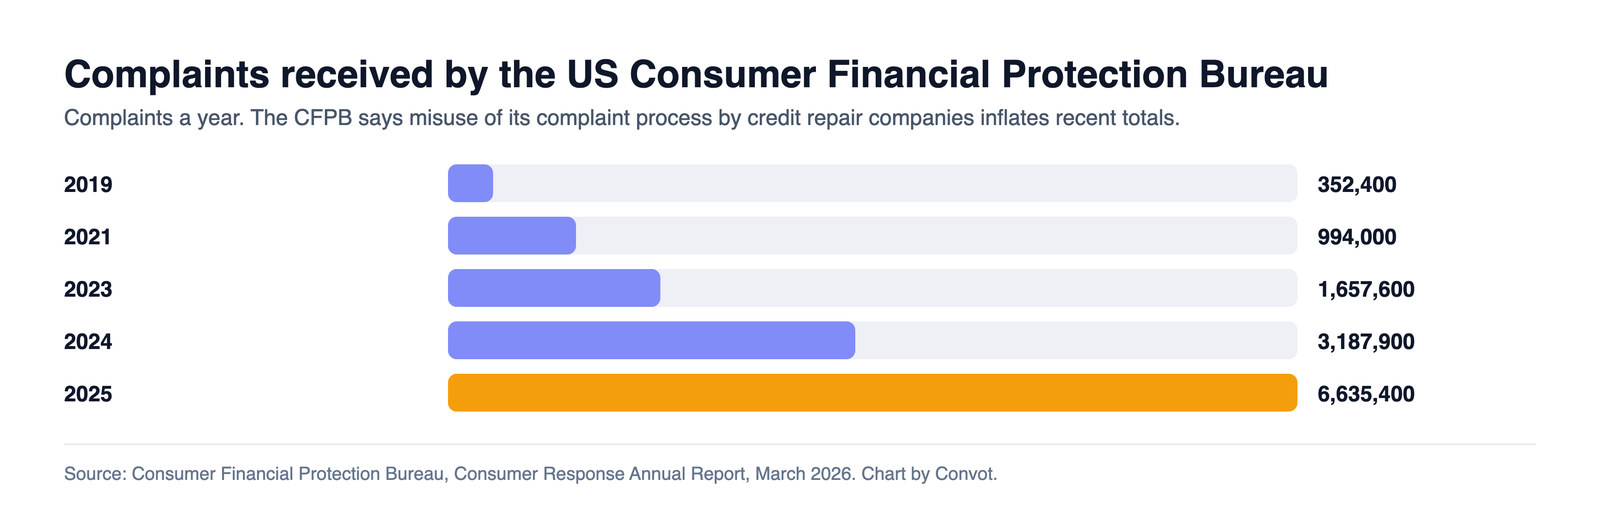 Figure 4: US financial complaints have grown nearly nineteenfold since 2019, although the CFPB itself says credit repair firms filing on consumers’ behalf inflate the recent totals. Source: CFPB, Consumer Response Annual Report, Mar 2026. Chart by Convot.
What do US consumers complain about?
Credit reporting dominates the CFPB’s caseload.
- Credit or consumer reporting accounted for more than 5.8 million complaints, 88% of all complaints the CFPB received in 2025 (CFPB, Consumer Response Annual Report, Mar 2026).
- The CFPB sent 97% of complaints to companies within a day, and companies gave a timely response to 99.6% of them (CFPB, Consumer Response Annual Report, Mar 2026).
- Monetary relief followed in under 1% of complaints; 53% were closed with an explanation and 37% with non-monetary relief (CFPB, Consumer Response Annual Report, Mar 2026).
- 88% of consumers who complained about credit reporting said they first tried to resolve the problem with the company (CFPB, Consumer Response Annual Report, Mar 2026).
- Debt collection drew 387,400 CFPB complaints in 2025, credit cards 114,100 and checking or savings accounts 104,200 (CFPB, Consumer Response Annual Report, Mar 2026).
- Prepaid card complaints had the highest monetary relief rate of any product, at 14% (CFPB, Consumer Response Annual Report, Mar 2026).
How big is fraud?
Fraud reports keep rising, and many start on social media.
- Imposter scams were the most reported fraud in 2025, with more than 1 million reports and $3.5 billion lost (Federal Trade Commission, Jun 2026).
- People reported losing $2.1 billion to scams that started on social media in 2025, and nearly 30% of people who lost money said the scam began there (Federal Trade Commission, Apr 2026).
- Consumers filed 2.6 million fraud reports with the FTC in 2024, before the 3 million of 2025 (Federal Trade Commission, Mar 2026).
- People reported losing nearly $1 billion to business impersonators in 2025, most of it to bank impersonators (Federal Trade Commission, Jun 2026).
- More than 40% of people who lost money to a scam on social media had ordered something they saw in a social media ad (Federal Trade Commission, Apr 2026).
What reaches the UK Financial Ombudsman?
UK ombudsman complaints fell sharply in 2025/26.
- The Financial Ombudsman Service received 214,600 new complaints in 2025/26, down almost 30% from 305,700, and upheld 30% on average (Financial Ombudsman Service, May 2026).
- Professional representatives brought 18% of cases in 2025/26, down from 50% the year before (Financial Ombudsman Service, May 2026).
- Current accounts drew 32,900 complaints, 18,900 of them about fraud and scams (Financial Ombudsman Service, May 2026).
- Motor hire purchase was the most complained-about product, with 37,700 complaints, down from 76,200 a year earlier (Financial Ombudsman Service, May 2026).
Which channels do customers use for service?
The phone has not gone away. Where regulators measure actual contacts, most still arrive by phone, while surveys show customers moving to chat, social messaging and AI tools.
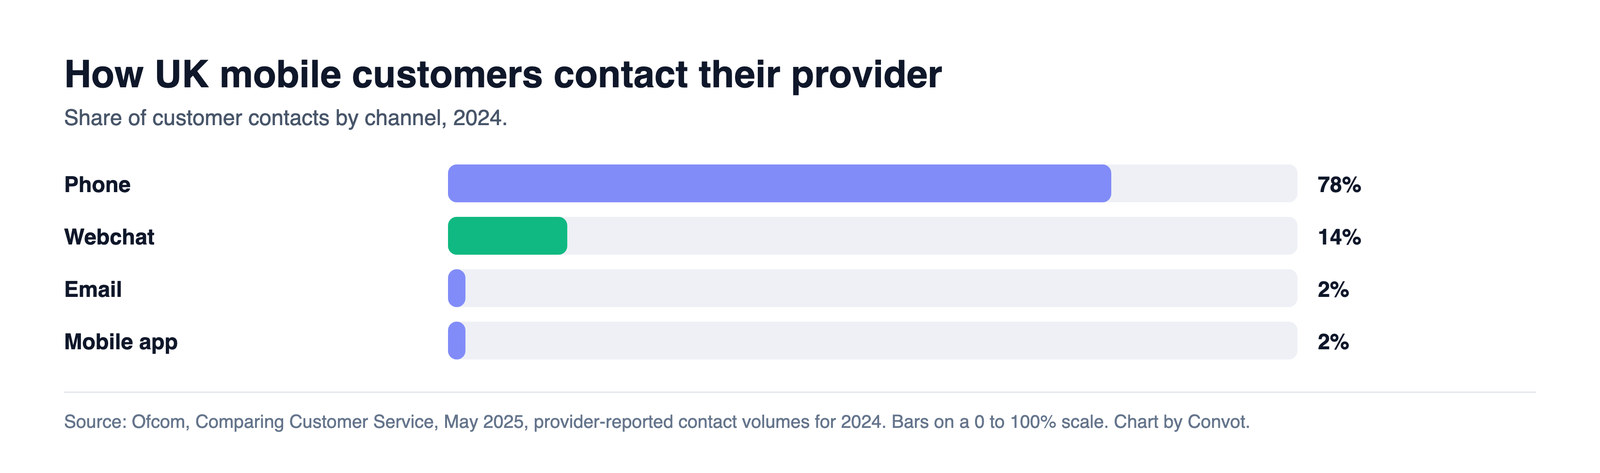 Figure 5: Even in a digital-first industry, nearly four contacts in five are phone calls, so a chat channel adds to the phone queue rather than replacing it. Source: Ofcom, Comparing Customer Service, May 2025. Chart by Convot.
How do customers reach companies?
Measured contacts and survey answers tell different stories.
- Webchat carried 6% of UK broadband and landline contacts in 2024, and phone 86% (Ofcom, Comparing Customer Service, May 2025).
- 79.6% of interactions with HM Revenue and Customs went through automated or digital self-serve channels in Q3 2025-26 (HM Revenue and Customs, Mar 2026).
- 55% of consumers would rather send a company a direct message than complain publicly on social media, in Sprout Social’s survey of 2,250 consumers (Sprout Social, Sep 2026).
- TikTok (50%), Facebook (46%) and Instagram (44%) are the platforms consumers turn to first for customer service on social media (Sprout Social, Sep 2026).
- 60% of customer service agents fail to promote self-service to customers, and customers whose agent promoted it were roughly twice as likely to use it next time (Gartner, Jun 2025).
Are customers using AI to get help?
Customers use outside AI tools far more than company chatbots.
- About half of US adults, 49%, now use AI chatbots, up from 33% in 2024 (Pew Research Center, Jun 2026).
- Customers were about three times more likely to use third-party generative AI tools than company-provided chatbots in their last service interaction (Gartner, Jul 2026).
- Only 35% of customers whose last interaction was by phone are willing to adopt a generative AI digital assistant (Gartner, Jun 2025).
- 49% of customers would have used a chatbot if offered, but only 7% used a chatbot or digital assistant in their most recent service interaction (Gartner, Sep 2026).
How fast do companies respond to customers?
Speed depends on the channel far more than on the company. Chat and written replies are usually answered in minutes or hours; phone queues still take minutes to tens of minutes.
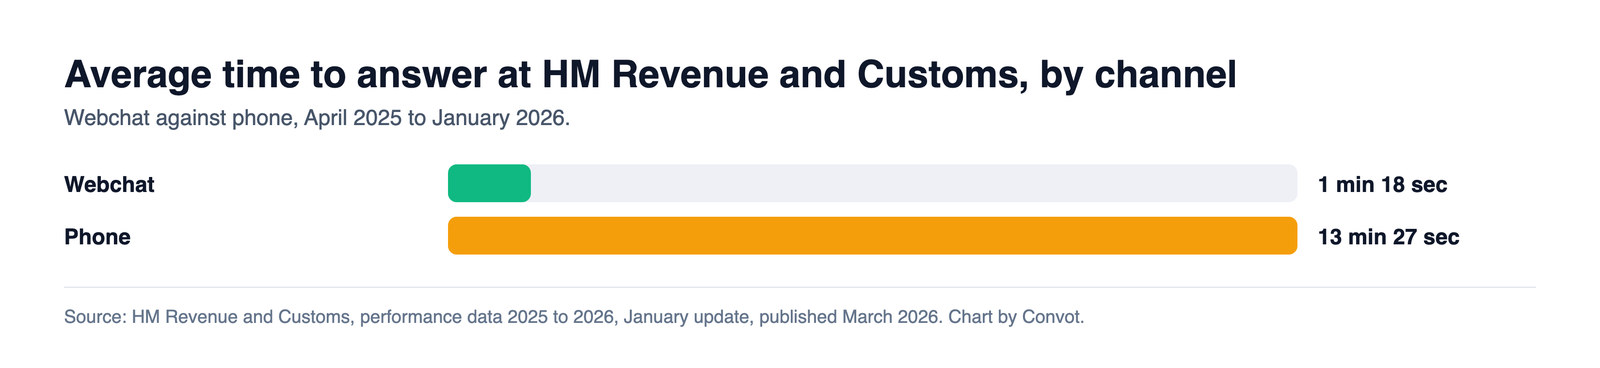 Figure 6: The same organisation answers webchat ten times faster than its phone line, a reminder that the channel you offer often sets the wait more than staffing does. Source: HM Revenue and Customs, Mar 2026. Chart by Convot.
How long do customers wait?
Public bodies publish the most reliable wait data.
- HMRC customer satisfaction was 56.5% on the phone, 73.0% on webchat and 82.3% on digital services in 2025-26 to January (HM Revenue and Customs, Mar 2026).
- The average IRS call wait rose to 8 minutes in the 2026 filing season from 3 minutes in 2025, while 41% of calls were answered by automation (U.S. Government Accountability Office, Jul 2026).
- UK telecoms callers waited about two minutes on average in 2024, and 6% of mobile calls were abandoned before reaching an adviser (Ofcom, Comparing Customer Service, May 2025).
What response times do customers expect?
Expectations are measured in hours on social media.
- 68% of consumers expect a brand to respond on social media within 24 hours, and 14% expect a reply within an hour (Sprout Social, Sep 2026).
- 74% of consumers expect customer service to be available 24/7 because of AI (Zendesk, Nov 2025).
- 86% of consumers say responsiveness and accurate resolution strongly influence their purchase decisions (Zendesk, Nov 2025).
How fast do software teams reply in public?
Our own app store studies show public review replies arrive in hours to days.
- Shopify app developers reply to App Store reviews a median 2 days after they are posted (Convot Shopify App Store review study, Oct 2026).
- Google Play developers reply to reviews a median of about 7 hours after they are posted, and 69.2% of replies come within a day (Convot Google Play study, Oct 2026).
How is AI changing customer service?
AI budgets are rising much faster than service budgets, and adoption is spreading quickly. Customers are warier: they want a human route, and few find the handoff smooth.
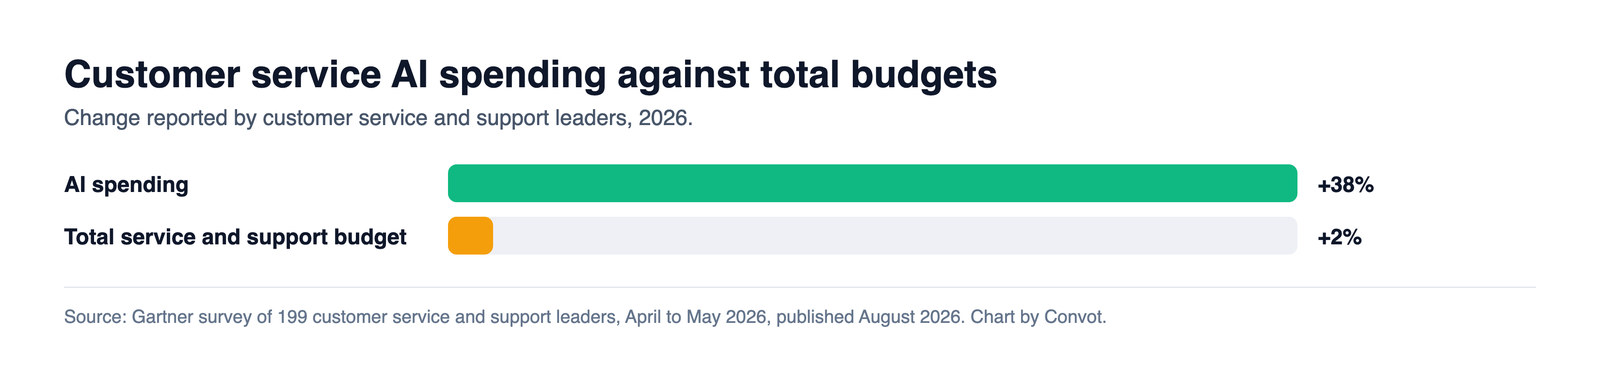 Figure 7: Service leaders are funding AI by moving money inside flat budgets, so AI has to pay for itself in saved agent time almost immediately. Source: Gartner, Aug 2026. Chart by Convot.
How widely is AI used in service?
Adoption figures from official statistics are lower than vendor surveys.
- 19.95% of EU enterprises with ten or more employees used AI in 2025, up 6.47 percentage points on 2024 (Eurostat, Jun 2026).
- 28.2% of Canadian businesses that used AI used it for virtual agents or chatbots in the second quarter of 2026 (Statistics Canada, Jun 2026).
- Service teams estimate 30% of cases are handled by AI today and expect 50% by 2027, in Salesforce’s survey of 6,500 service professionals (Salesforce, State of Service, Nov 2025).
- 43.6% of customer service teams use AI across their service workflows, up from 32% in 2025, according to Freshworks data from 33,889 accounts (Freshworks, Sep 2026).
- 85% of customer service organisations use at least one form of AI (Salesforce, May 2026).
- 19.2% of Canadian businesses used AI to produce goods or deliver services in the second quarter of 2026, triple the share two years earlier (Statistics Canada, Jun 2026).
What are service leaders doing about AI?
Pressure from the top is near universal.
- 91% of service leaders report executive pressure to implement AI (Gartner, Feb 2026).
- Service and support leaders put a median 12% of their 2025 budget into AI, the highest of ten functions, but only 24% see positive financial returns across AI use cases (Gartner, Jul 2026).
- 51% of service organisations say security concerns delayed or limited their AI initiatives (Salesforce, State of Service, Nov 2025).
- AI rose from service leaders’ tenth priority to their second in a year (Salesforce, State of Service, Nov 2025).
- 70% of organisations using AI service agents saw measurable value within 60 days (Salesforce, May 2026).
- 77% of service leaders feel pressure to deploy AI, and 75% report higher AI budgets than a year earlier (Gartner, Oct 2025).
How do customers feel about AI service?
Most want a person available.
- Only 27% of customers would try a chatbot again after a negative experience (Gartner, Sep 2026).
- 59% of consumers are satisfied with conversational AI, against 90% of business leaders who believe their customers are satisfied (Twilio, Nov 2025).
- Nearly one in five consumers who used AI for customer service saw no benefit, a failure rate almost four times that of AI use in general (Qualtrics XM Institute, Oct 2025).
- 79% of Americans strongly prefer a human over an AI agent for customer service, in a SurveyMonkey poll of 2,017 adults (SurveyMonkey, Feb 2026).
- 89% of Americans say companies should always offer a human option for customer service (SurveyMonkey, Feb 2026).
- 69% of consumers prefer interacting with real people, but 72% would choose an AI agent if it guaranteed a faster fix (Twilio, Nov 2025).
- Misuse of personal data is consumers’ top concern about AI in service, named by 53%, and 50% worry AI will stop them reaching a person (Qualtrics XM Institute, Oct 2025).
- 54% of customers trust human agents more than AI for product or service recommendations, and 32% trust AI more (Gartner, Apr 2026).
- 95% of consumers expect an explanation for decisions made by AI, but only 37% of CX leaders say they currently offer one (Zendesk, Nov 2025).
For more on AI in support, see the AI customer service statistics.
Does good customer service pay off?
The best evidence links service scores to what customers actually do, not what they say they will do. Those studies show a clear payoff for top scores, and a large gap between how loyal executives think customers are and how loyal customers feel.
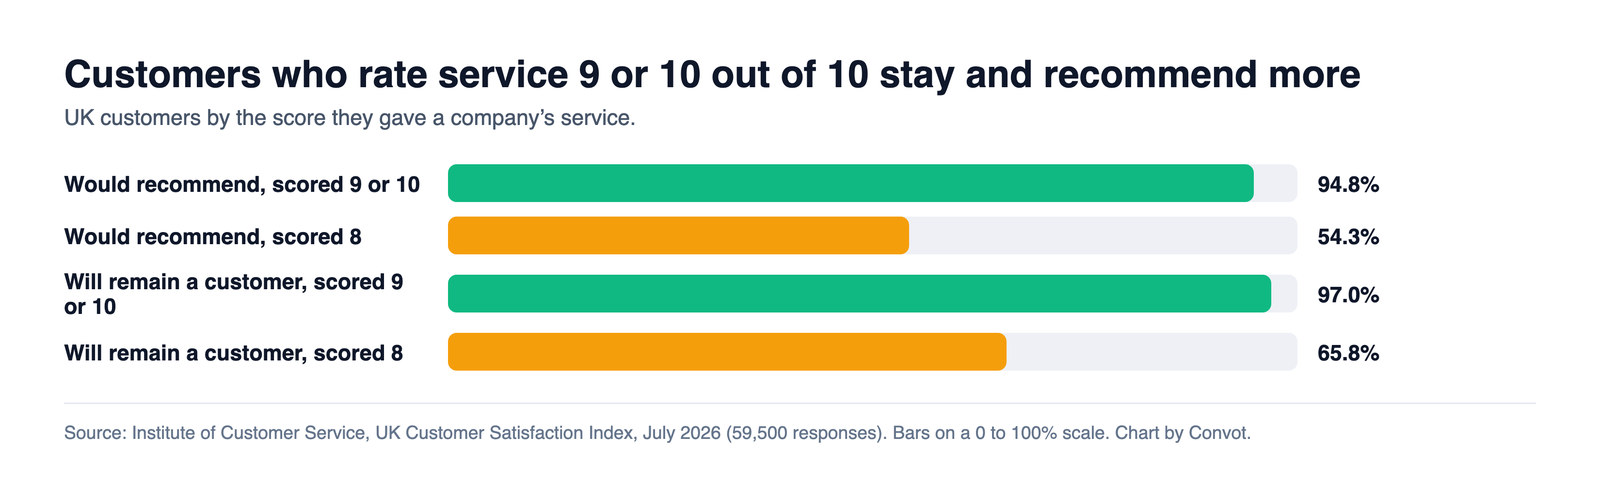 Figure 8: The step from a good score of 8 to an excellent 9 or 10 is worth far more than it looks, because that is where recommendation and retention jump. Source: Institute of Customer Service, UKCSI, Jul 2026. Chart by Convot.
What does service do to spending and switching?
Measured behaviour backs the survey answers.
- UK banks scoring at least 1 point above their sector average gained 17,389 net current accounts in Q4 2025, while banks 1 point below lost 3,098 on average (Institute of Customer Service, Jul 2026).
- 34.4% of UK customers will pay more for better service, against 11.6% who put price above all (Institute of Customer Service, Jul 2026).
- UK food retailers scoring at least 1 point above their sector average grew sales 4.3%, against 2.3% for the market (Institute of Customer Service, Jul 2026).
- 47% of bad customer experiences lead to customers cutting their spending, and only 29% of customers tell the company after a bad experience (Qualtrics XM Institute, Oct 2025).
Do companies see loyalty the way customers do?
Companies see far more loyalty than their customers report.
- About nine in ten executives say customer loyalty has grown, but only four in ten consumers say they have become more loyal (PwC, 2025 Customer Experience Survey, Sep 2025).
- 86% of US consumers say human interaction is moderately or very important in their experience with a brand (PwC, 2025 Customer Experience Survey, Sep 2025).
- 58% of US consumers are only somewhat or not at all comfortable using AI tools to deal with brands (PwC, 2025 Customer Experience Survey, Sep 2025).
- 84% of Americans say a positive customer support experience greatly affects how they see a company (SurveyMonkey, Feb 2026).
- 73% of social media users say they would buy from a competitor if a brand does not respond to them on social (Sprout Social, Sep 2026).
What does customer service cost?
The biggest cost is people, and software is a fraction of it. AI now adds a third line, priced in ways that are hard to compare.
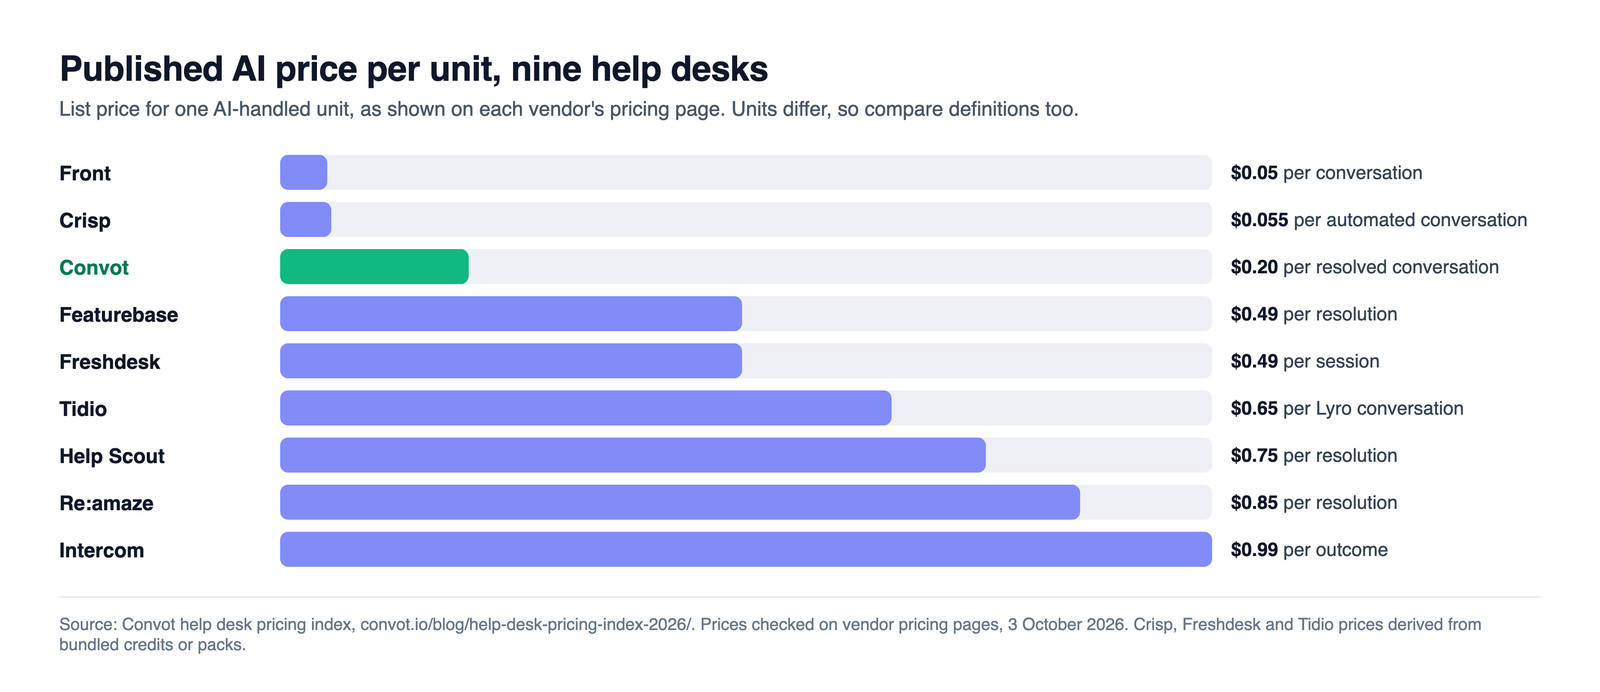 Figure 9: AI help desk pricing varies twentyfold per unit, so the same AI volume can cost a small team $50 or $990 a month depending on the tool. Source: Convot help desk pricing index, Oct 2026. Chart by Convot, which sells one of the tools shown.
What does a support team cost to run?
Wages set the floor, software adds a little on top.
- Customer service representatives at the 10th percentile earn $15.27 an hour and at the 90th percentile $30.57 (U.S. Bureau of Labor Statistics, OEWS, May 2026).
- A help desk for three people costs $0 to $165 a month on the cheapest plan that fits, billed annually (Convot help desk pricing index, Oct 2026).
- At 1,000 AI resolutions a month, list prices range from $200 on Convot to $990 on Intercom’s Fin, before seat or plan fees (Convot help desk pricing index, Oct 2026).
Does AI make service faster?
Platform data says yes, with caveats on who adopts it.
- On Freshdesk, average first response fell from 11 minutes 16 seconds at teams with low AI copilot adoption to 7 minutes 28 seconds at teams with high adoption (Freshworks, Sep 2026).
- Average resolution time on Freshdesk was 9 minutes 21 seconds where AI agents handle up to a quarter of conversations, and 4 minutes 36 seconds where they handle half or more (Freshworks, Sep 2026).
- Reps using AI spend 20% less time on routine cases, about four hours a week, in Salesforce’s survey (Salesforce, State of Service, Nov 2025).
Convot is a help desk for small software teams running one or several apps, with an AI agent priced at $0.20 per resolved conversation. Price your own setup in the help desk price calculator.
Methodology and Sources
The audit. In October 2026 we collected the statistics repeated most often in Google’s AI Overview for “customer service statistics” and on the vendor statistics pages it cites (Zendesk, Nextiva, Freshworks, Shopify, Help Scout, AmplifAI, Salesforce). For each of the ten most repeated, we followed the citation trail to the organisation that ran the study and compared the original wording, date and sample with the quoted version. Verified means the origin was found and the wording matches. Misquoted means the origin says something materially different. Stale means the origin matches but the data predates 2022. Untraceable means the trail ends at roundups or at a study with no name, date or sample.
Primary data. Everything else is cited to the organisation that produced it: statistics offices and regulators (BLS, CFPB, FTC, Ofcom, HMRC, GAO, Eurostat, Statistics Canada, the Financial Ombudsman Service), the UK Institute of Customer Service, Pew Research Center, and companies publishing their own surveys or platform data (Gartner, Salesforce, Zendesk, Freshworks, Twilio, Qualtrics, PwC, Forrester, Sprout Social, SurveyMonkey), with samples stated in the text where they matter. Vendor surveys measure what people say, not what they do, and vendors publish findings that suit their products; we label them by publisher so you can judge. The 2025 Ofcom report is the latest edition; the CFPB warns its 2025 complaint total is inflated by credit repair companies.
What is left out. The American Customer Satisfaction Index publishes US satisfaction scores, but its terms prohibit reuse of its data without written consent, so this page uses the UK index instead. We found no government figure for the cost of a customer service contact.
Convot data. The app review figures come from our Shopify App Store and Google Play studies, and prices from our help desk pricing index, each checked in October 2026.
Sources
- Convot research: Convot audit; Shopify app support statistics; mobile app support statistics; help desk pricing index; live chat statistics; AI customer service statistics.
- Government and regulators: BLS Occupational Outlook Handbook; BLS OEWS; CFPB Consumer Response Annual Report; FTC fraud testimony; FTC imposter scams; FTC social media scams; GAO, IRS filing season; Ofcom, Comparing Customer Service; HMRC performance data; Financial Ombudsman Service; Eurostat; Statistics Canada.
- Satisfaction and research bodies: Institute of Customer Service, UKCSI; Pew Research Center; Forrester; Harvard Business Review; Bain & Company.
- Company surveys and platform data: Gartner press releases linked in the text; Salesforce, State of Service; Salesforce, AI agents edition; Zendesk CX Trends 2026; Freshworks; Twilio; Qualtrics XM Institute; PwC; Sprout Social; SurveyMonkey; HubSpot.
Revenue-aware support for Shopify app teams.
Live chat, help center, and every merchant's MRR, plan, and LTV beside the conversation. Free under $1k MRR.
Start free