104 Live Chat Statistics for 2026 (Updated October)
104 live chat statistics, each traced to its original source: response times, wait and dropout, satisfaction, AI, sales impact and cost. Updated monthly.
On this page
- Key Takeaways
- How widely is live chat offered?
- How fast do teams answer live chat?
- How long do customers wait, and when do they give up?
- How satisfied are customers with live chat?
- Which channel do customers prefer?
- How much work does live chat create for agents?
- How is AI changing live chat?
- Does live chat increase sales?
- What does live chat software cost?
- Methodology and Sources
- Sources
Live chat is the support channel customers use more than they say they prefer, answered in seconds on good days and abandoned by one customer in four on bad ones. These 104 statistics show how live chat actually performs in 2026: how widely it is offered, how fast teams answer, how long customers wait, how satisfied they are, what AI is changing, whether chat sells, and what it costs.
Every number is traced to the organisation that produced it: the statistics office, research firm, university team or company that ran the study. Much of the best live chat data comes from chat vendors measuring their own platforms, and the text says so each time. Older studies are kept only where nothing newer measures the same thing, and their year is stated. The cost section uses Convot’s own data, collected from vendor pricing pages.
Updated October 2026. We check every link and price monthly and replace numbers when a newer study is published.
Key Takeaways
- Live chat agents send a first reply in 35 seconds on average, across 2 billion chats on the LiveChat platform (LiveChat, Dec 2024).
- 27.4% of customers leave the live chat queue before an agent answers (LiveChat, Dec 2024).
- In a mystery-shopper test of 1,000 websites, 21% of live chat requests were never answered (SuperOffice, Jan 2021).
- AI agents handle 75.3% of chats in Comm100’s 2026 benchmark of more than 220 million live chat interactions (Comm100, Jan 2026).
- 9.13% of EU businesses with 10 or more staff offered a chat service on their website in 2025 (Eurostat, Feb 2026).
- 31% of Americans tend to use live chat for customer service, but only 10% prefer it (YouGov, Mar 2025).
- 75% of US and UK consumers prefer talking to a real human in person or by phone for customer support (Five9, Oct 2024).
- Chat scored 819 out of 1,000 for satisfaction, the highest of five service channels in J.D. Power’s 2016 study (J.D. Power, Jan 2017).
- Chat first responses are 38 times faster than email first responses for ecommerce brands on Gorgias (Gorgias, May 2026).
- An agent actively chatting with one extra customer took 34 seconds longer to respond, a 60% slowdown (Goes et al., Management Science, Jul 2018).
- A GPT-based support bot cut escalations to a human engineer from 17.1% to 7.9% in a randomized trial (Microsoft field experiment, arXiv, Jan 2024).
- A live chat conversation raised the purchase probability of tablets by 15.99% on Alibaba’s marketplace (Information Systems Research, Dec 2019).
- Live chat for a team of three costs from $0 to $87 a month across nine tools, before AI and add-ons (Convot, Oct 2026).
How widely is live chat offered?
Live chat is common but far from universal, and in Europe it is slightly shrinking in retail as chatbots and messaging apps take some of its place. The fastest growth is in AI-driven chat, not in human chat windows.
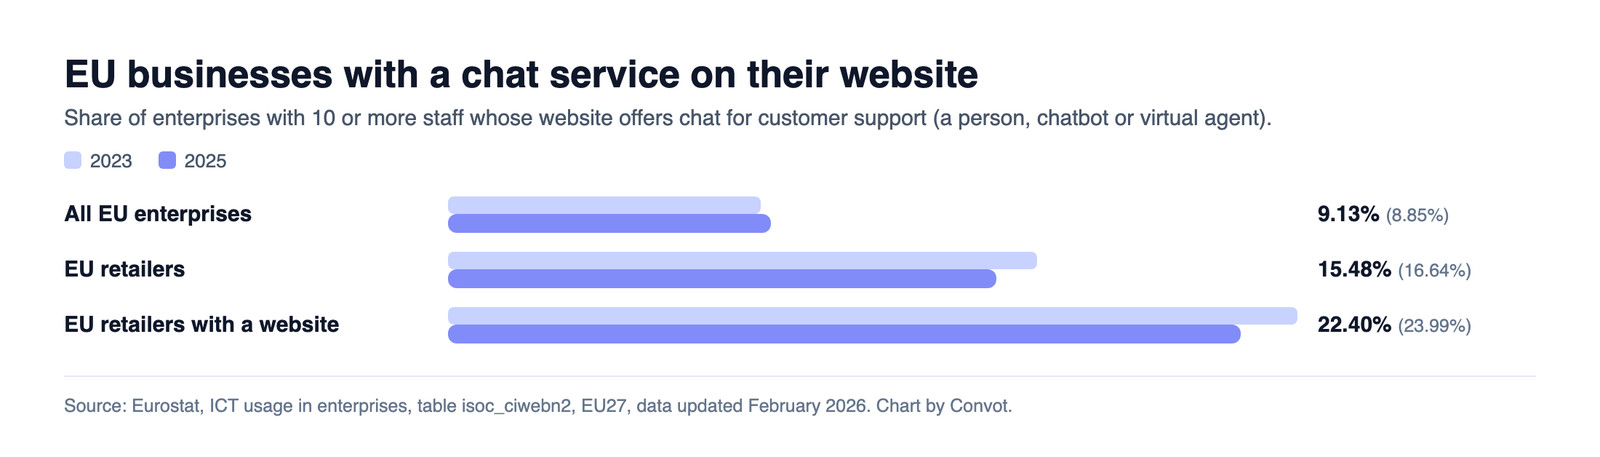 Figure 1: Fewer than one EU business in ten offers website chat, and retail adoption slipped between 2023 and 2025, so a chat window is still a way to stand out rather than a given. Source: Eurostat, ICT usage in enterprises, table isoc_ciwebn2, Feb 2026. Chart by Convot from Eurostat data, captured 3 Oct 2026.
How many businesses offer website chat?
Official statistics put website chat at a minority of businesses, higher in retail.
- 15.48% of EU retailers offered a chat service on their website in 2025, down from 16.64% in 2023 (Eurostat, Feb 2026).
- Among EU retailers that have a website, 22.40% offered chat on it in 2025, against 23.99% in 2023 (Eurostat, Feb 2026).
- In 2020, 11.89% of EU enterprises had a chat service where a person replies to customers, against 2.33% where a chatbot or virtual agent replies (Eurostat, Feb 2026).
How fast is chat automation spreading?
Statistics Canada tracks chatbots inside its business AI survey, and the share keeps climbing.
- 28.2% of Canadian businesses that used AI in the past year used it for virtual agents or chatbots in the second quarter of 2026, up from 24.8% a year earlier (Statistics Canada, Jun 2026).
- 50.5% of Canadian businesses with 100 or more employees that used AI used it for virtual agents or chatbots, the most common use in that size band (Statistics Canada, Jun 2026).
- 50.9% of AI-using Canadian businesses in information and cultural industries used virtual agents or chatbots (Statistics Canada, Jun 2026).
- 34.8% of Canadian businesses planning to use AI named virtual agents or chatbots as the planned use, up from 18.7% a year earlier (Statistics Canada, Sep 2025).
Do businesses value live chat?
Support leaders now rank live chat among their most valuable channels, and commerce platforms report rising chat-driven sales.
- In a survey of 265 customer service leaders, live chat ranked among the most valuable service technologies and is expected to overtake phone and email within two years (Gartner, Aug 2025).
- Shopify reported that sales attributed to a chat interaction on Shopify grew 339% during the COVID period (Shopify, Jul 2021).
How fast do teams answer live chat?
The best live chat teams answer in well under a minute; the gap between fast and slow is about team size and hours, not effort. Small teams on LiveChat answer faster than mid-sized ones.
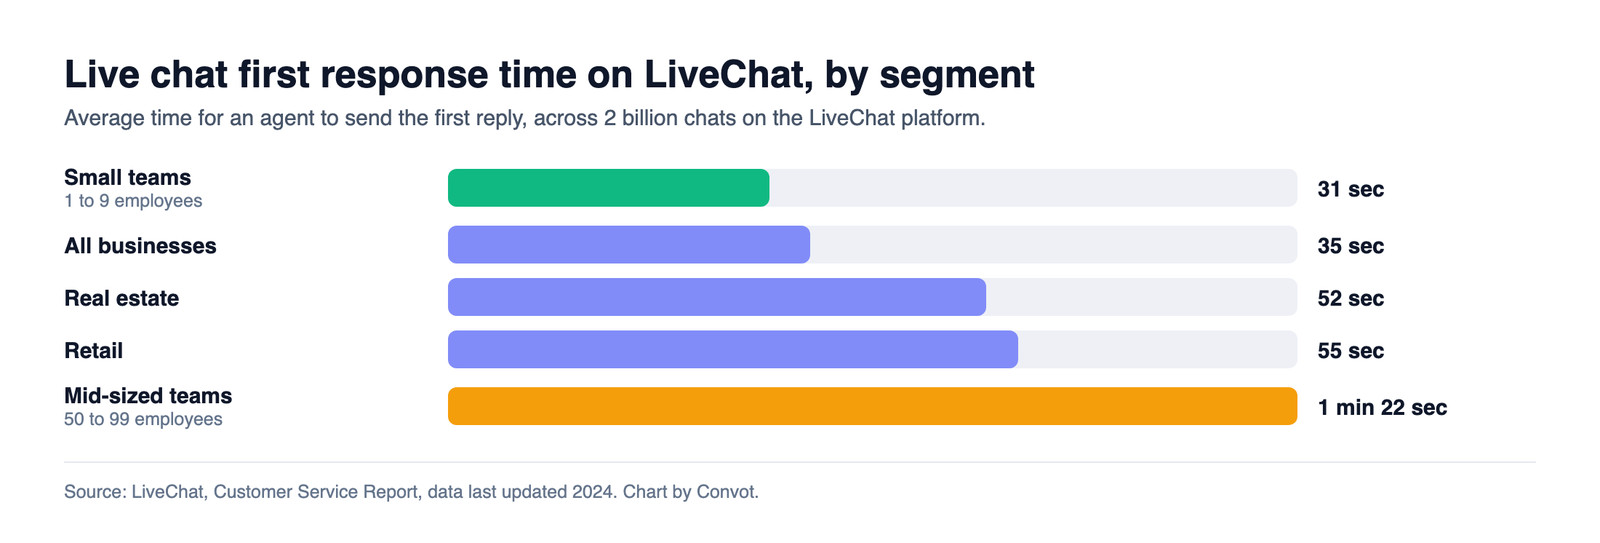 Figure 2: Small teams reply fastest and mid-sized teams slowest, which suggests the routing and queues that come with growth cost more speed than a lean team loses to being busy. Source: LiveChat, Customer Service Report, Dec 2024. Chart by Convot from LiveChat data, captured 3 Oct 2026.
What is a normal first response time?
Platform data puts a typical first reply between half a minute and two minutes.
- Retail first response time on LiveChat is 55 seconds, about 20 seconds slower than the platform average (LiveChat, Dec 2024).
- Small teams of 1 to 9 employees respond in 31 seconds on LiveChat, while teams of 50 to 99 employees take 1 minute 22 seconds (LiveChat, Dec 2024).
- Tidio’s own data puts the average live chat response time at 1 minute 35 seconds (Tidio, Feb 2026).
- In the top 15 industries on Freshchat, agents answered a first interaction within an hour, and in 80% of those industries within 10 minutes (Freshworks, Jun 2023).
- In an unannounced test of 1,000 websites, the average wait before an agent replied was 2 minutes 40 seconds, ranging from 30 seconds to 9 minutes (SuperOffice, Jan 2021).
- Comm100 reports that large support teams cut wait times by 37.5% while small teams saw increases (Comm100, Jan 2026).
How many hours a day is live chat available?
Coverage, not speed, is where many teams fall short.
- Businesses on LiveChat are available on chat for 17 hours 58 minutes a day on average (LiveChat, Dec 2024).
- Real estate businesses on LiveChat are available for only 11 hours 3 minutes a day (LiveChat, Dec 2024).
- 74% of consumers now expect customer service to be available 24/7 because of AI (Zendesk, Nov 2025).
- 66% of US consumers in a HubSpot survey of 100 people expect a live chat response within five minutes (HubSpot, May 2025).
How long do customers wait, and when do they give up?
Customers give up on live chat far more often than teams notice, because many leave without saying anything. The waits are longer than dashboards suggest.
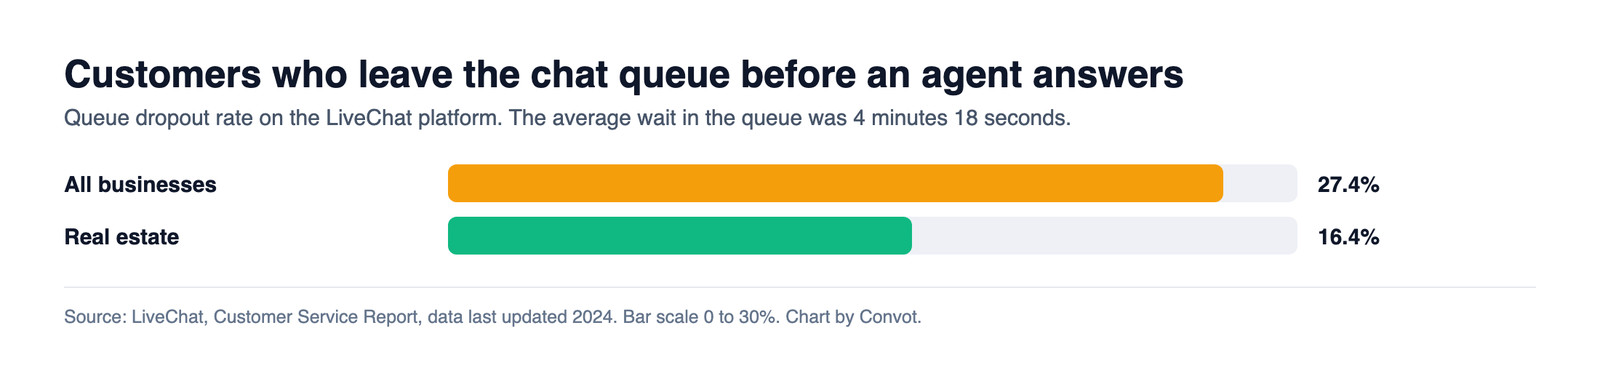 Figure 3: More than one customer in four leaves the queue before reaching an agent, while real estate keeps most of them, so dropout is a staffing choice as much as a customer habit. Source: LiveChat, Customer Service Report, Dec 2024. Chart by Convot from LiveChat data, captured 3 Oct 2026.
How long is the live chat queue?
On LiveChat, customers who meet a queue wait more than four minutes.
- Customers on LiveChat wait 4 minutes 18 seconds in the queue on average before reaching an agent (LiveChat, Dec 2024).
- Real estate has a queue dropout rate of 16.4% on LiveChat, well below the platform average (LiveChat, Dec 2024).
How many customers leave without saying so?
Research on text-based contact centres shows a large share of abandonment is silent, which distorts every wait-time metric.
- Across 17 companies with text-based contact centres, between 3% and 70% of customers abandon silently, leaving without telling the system (Castellanos et al., arXiv, Jan 2025).
- In one US telecom’s messaging centre, 71.3% of abandoning customers did so silently, cutting system capacity by 15.3% (Castellanos et al., arXiv, Jan 2025).
- Letting customers type while they wait in the queue significantly increased their patience and reduced abandonment (Castellanos et al., arXiv, Jan 2025).
- Customer patience in that telecom’s asynchronous messaging centre was estimated at 81 minutes, far longer than in real-time chat or calls (Castellanos et al., arXiv, Jan 2025).
How satisfied are customers with live chat?
Chat earns satisfaction when it resolves the problem and feels human; scores fall hard on either failure. Read live chat CSAT figures carefully, because only a small share of chats get rated.
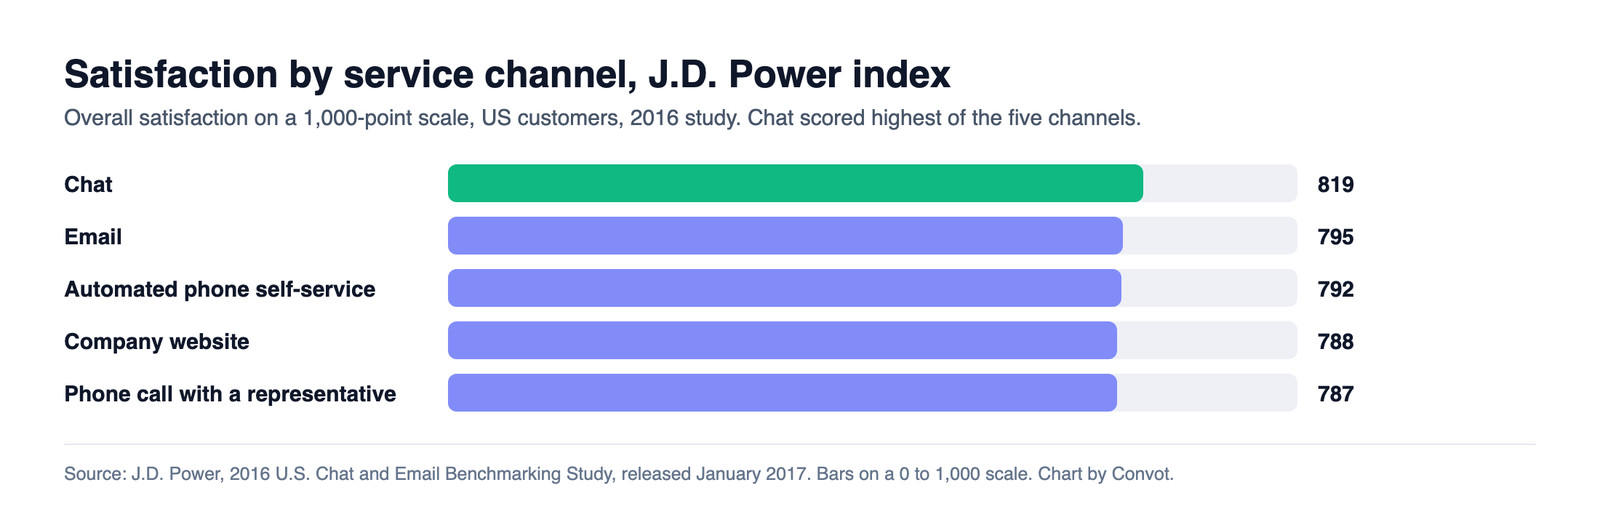 Figure 4: Chat led every other channel in J.D. Power’s study, though only narrowly, so the case for chat is speed and convenience more than a large satisfaction gap. Source: J.D. Power, 2016 U.S. Chat and Email Benchmarking Study, Jan 2017. Chart by Convot from J.D. Power data, captured 3 Oct 2026.
What is a typical live chat CSAT score?
Platform averages sit in the 60s on a percentage scale and around 4 out of 5 on a five-point scale.
- Across all rated chats on LiveChat, average customer satisfaction was 64.2% (LiveChat, Dec 2024).
- Only 6.7% of chats on LiveChat were rated by customers, so CSAT reflects a small, self-selected share (LiveChat, Dec 2024).
- Real estate had a chat CSAT of 74% on LiveChat, the strongest industry in the report (LiveChat, Dec 2024).
- Financial services chat CSAT was 66.2% on LiveChat (LiveChat, Dec 2024).
- In financial services, teams of 50 to 99 employees scored 83.2% CSAT against 75.7% for teams of 1 to 9, while handling 19.9 chats per agent a day against 37.2 (LiveChat, Dec 2024).
- Comm100 puts average satisfaction for human-handled chats at 4.1 out of 5 (Comm100, Jan 2026).
What makes customers unhappy with a chat?
An unresolved issue and an agent who does not understand do the most damage.
- When an issue goes unresolved, customer satisfaction drops to 2.83 on a five-point scale (Qualtrics XM Institute, Jun 2026).
- When an issue goes unresolved, customers rate the agent’s understanding 37% lower, a bigger drop than for knowledge or friendliness (Qualtrics XM Institute, Jun 2026).
- Across channels, consumers rate agents friendlier, at 4.36, than knowledgeable, at 4.17, or understanding, at 4.16 (Qualtrics XM Institute, Jun 2026).
- Chat satisfaction dropped from 835 to 756 when customers felt the reply was not from a real person (J.D. Power, Jan 2017).
Does the channel itself change satisfaction?
The channel matters less than the outcome, and older customers rated chat highest.
- Satisfaction with chat rose with age in J.D. Power’s study: Boomers 831, Gen X 826 and Millennials 811 (J.D. Power, Jan 2017).
- Customer effort and satisfaction do not differ statistically between service channels, and loyalty is not affected by the availability of a preferred channel (Gartner, Sep 2019).
Which channel do customers prefer?
People use live chat more than they prefer it, because it is often the channel on offer. Phone is still the stated favourite, especially for older customers.
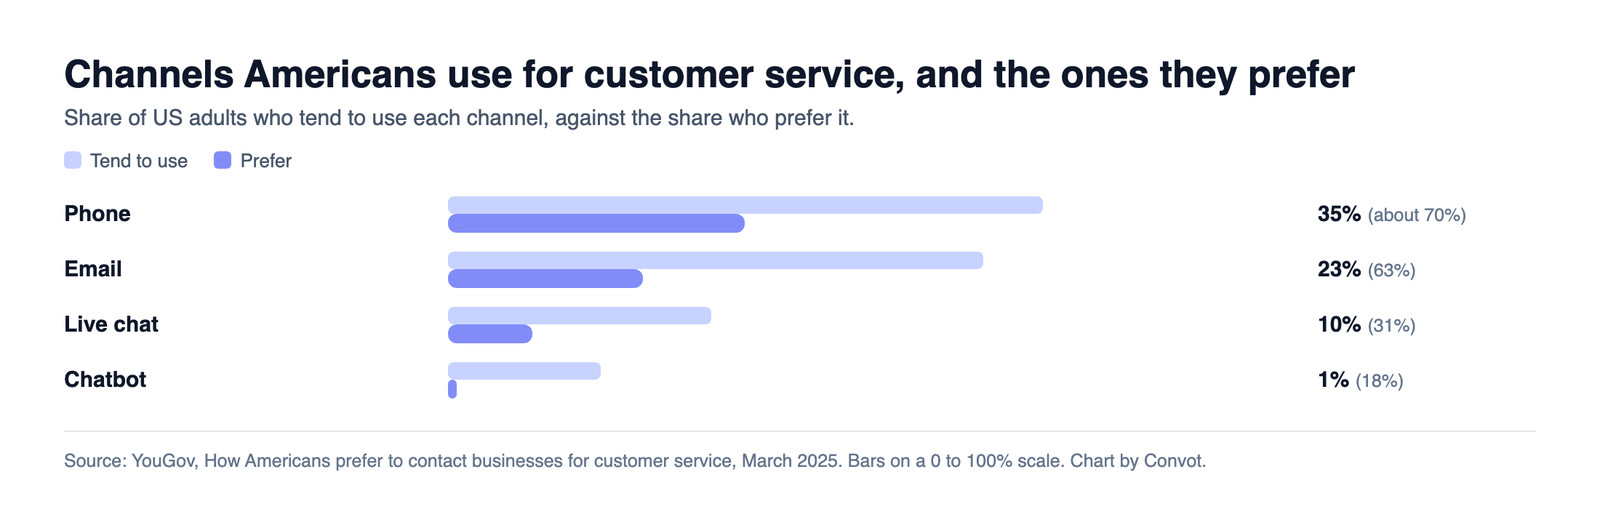 Figure 5: Every channel is used more than it is preferred, and the gap is widest for chatbots, so availability, not preference, drives much of live chat’s volume. Source: YouGov, How Americans prefer to contact businesses for customer service, Mar 2025. Chart by Convot from YouGov data, captured 3 Oct 2026.
How do channel use and preference compare?
Phone and email are used far more than they are preferred, and the same holds for chat.
- Nearly 70% of Americans tend to use phone support but only 35% prefer it; email is used by 63% and preferred by 23% (YouGov, Mar 2025).
- Women prefer live chat more than men, 12% against 8%, and higher earners prefer it more, at 15% (YouGov, Mar 2025).
- 47% of customers used chat or email to contact a company for service in the previous 12 months, with chat use highest in telecom at 26% (J.D. Power, Jan 2017).
- In a HubSpot survey of 100 US consumers, 57% preferred phoning a company for first contact, against 26% for live chat (HubSpot, May 2025).
How does age change channel preference?
Younger customers are far more open to chat; older customers lean heavily to the phone.
- Phone preference falls by generation: 52% of Baby Boomers, 39% of Gen X, 30% of Millennials and 25% of Gen Z (YouGov, Mar 2025).
- Preference for a human in person or by phone rises with age, from 66% of Gen Z to 76% of Gen X and 86% of Baby Boomers and the Silent Generation (Five9, Oct 2024).
- In an earlier Gartner survey of 8,398 customers, preferred channels for issue resolution were phone at 44%, chat at 17% and email at 15% (Gartner, Sep 2019).
- 95% of consumers say carrying context across channels, so they never repeat themselves, matters (Genesys, Jul 2026).
How much work does live chat create for agents?
Live chat lets one agent serve several customers at once, but every extra conversation costs speed and quality. Concurrency is a trade-off, not free capacity.
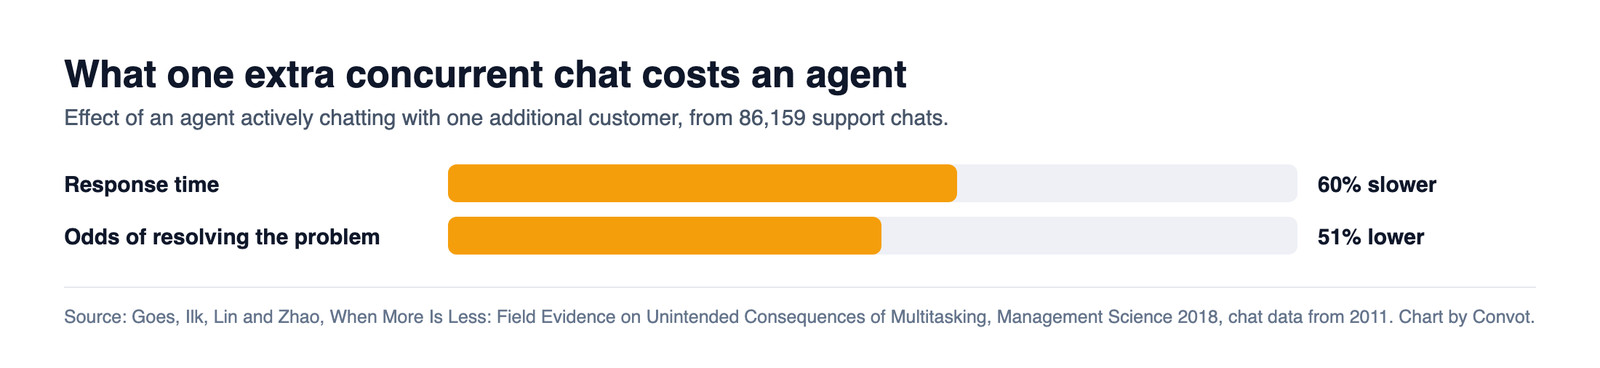 Figure 6: Taking on one more chat at once slowed replies and halved the odds of resolving the problem already in hand, so chat concurrency limits protect quality as well as speed. Source: Goes, Ilk, Lin and Zhao, When More Is Less, Management Science, Jul 2018. Chart by Convot from the study’s estimates, captured 3 Oct 2026.
How many chats does an agent handle?
Busy chat agents handle dozens of conversations a day and spend most of their shift chatting.
- Support agents on LiveChat handle 84.1 chats a day on average (LiveChat, Dec 2024).
- Agents on LiveChat spend about 11 hours 48 minutes a day actively chatting (LiveChat, Dec 2024).
- The average live chat on LiveChat lasts 8 minutes 25 seconds (LiveChat, Dec 2024).
- Comm100 reports agent workloads dropped 5.8% while chat duration stayed flat (Comm100, Jan 2026).
How many chats can one agent run at once?
In messaging, agents juggle several conversations because most of each conversation is waiting time.
- One telecom messaging centre averaged 4.79 concurrent customers per agent across about 135 online agents (Daw et al., arXiv, Apr 2020).
- The same centre received about 603 new conversations an hour, 337,224 in a month (Daw et al., arXiv, Apr 2020).
- Its messaging conversations averaged 53.5 minutes and 14.7 messages, with agents writing 72.1% of the messages (Daw et al., arXiv, Apr 2020).
- 57.5% of five-minute intervals within those conversations contained no messages at all, which is what makes concurrency possible (Daw et al., arXiv, Apr 2020).
- Actively chatting with one additional customer cut the odds of resolving the existing customer’s problem by about 51% (Goes et al., Management Science, Jul 2018).
- Nearly 80% of service organizations plan to move at least some agents into new roles as automation takes routine work (Gartner, Feb 2026).
How is AI changing live chat?
AI now handles a large and growing share of chats, and the handoff to a human is where satisfaction is won or lost. The better AI bots escalate less, not more.
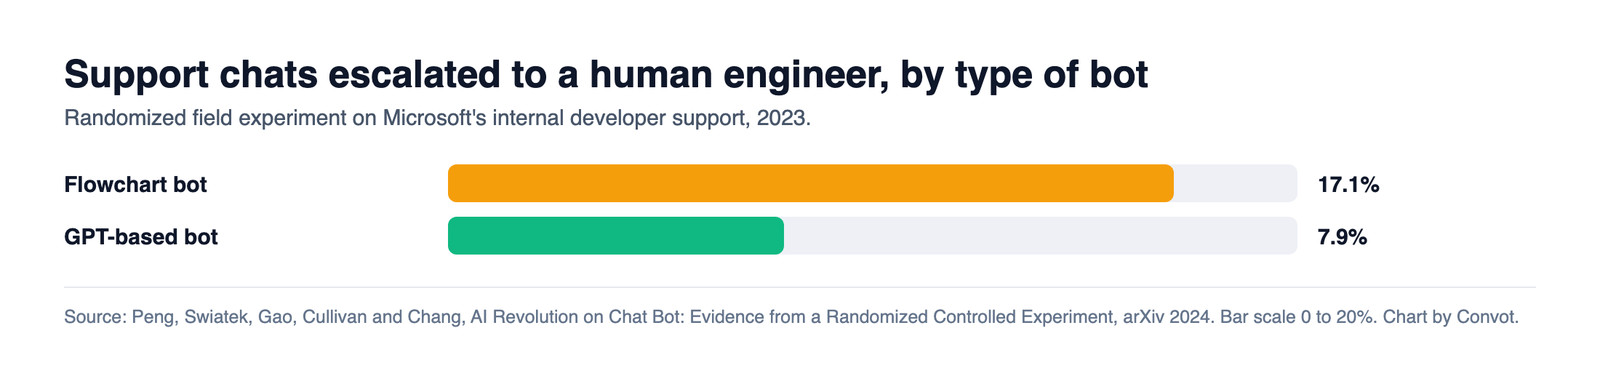 Figure 7: Swapping a scripted bot for a GPT-based one halved escalations in a controlled trial, the clearest evidence so far that modern AI chat resolves more on its own. Source: Peng et al., AI Revolution on Chat Bot, arXiv, Jan 2024. Chart by Convot from the trial’s results, captured 3 Oct 2026.
How much of live chat does AI handle?
Estimates range widely by platform and definition, from bot participation to full handling.
- A chatbot took part in 163.5 million of 1.68 billion chats on LiveChat, about one chat in ten (LiveChat, Dec 2024).
- Service teams estimate AI handles 30% of cases today and expect 50% by 2027 (Salesforce, Nov 2025).
- Freshworks reports an average AI agent deflection rate of 83.1% across industries on its platform in 2026 (Freshworks, Sep 2026).
- 82% of senior support leaders invested in AI for customer service in the past year, but only 10% of teams have reached mature deployment (Intercom, Jan 2026).
Are customers satisfied with AI chat?
Chatbot satisfaction now matches human chat on some platforms, and it varies sharply by industry.
- Chatbot satisfaction on LiveChat was 64.7%, against 64.2% for all rated chats (LiveChat, Dec 2024).
- Chatbot satisfaction was 74.4% in retail but 59.2% in software and services on LiveChat (LiveChat, Dec 2024).
- Comm100 reports chatbot satisfaction rose 9.1% in its 2026 benchmark (Comm100, Jan 2026).
- Customers handed off from a chatbot to an agent gave a 92.6% CSAT in Comm100’s 2026 benchmark (Comm100, Jan 2026).
- 87% of customers say companies using GenAI must offer a way to reach a human (Gartner, Aug 2026).
Does AI make chat teams faster?
Teams that use more AI report faster resolution and response, though the evidence is mostly correlational.
- Teams whose AI agents handle 50% to 100% of conversations average 4 minutes 36 seconds to resolution, against 9 minutes 21 seconds at 0% to 25% (Freshworks, Sep 2026).
- Teams with 50% to 100% AI copilot adoption average a 7 minute 28 second response time, against 11 minutes 16 seconds at 0% to 25% (Freshworks, Sep 2026).
- Reps using AI spend 20% less time on routine cases, about four hours a week (Salesforce, Nov 2025).
- 62% of teams say support metrics improved since adopting AI, rising to 87% among mature deployments (Intercom, Jan 2026).
- In an A/B test at Nubank, an AI support agent raised the self-service rate by 29 percentage points and transactional NPS by 37 points (Nubank, arXiv, Jun 2026).
- Forrester predicted that in 2026 a third of companies will harm customer experience with frustrating AI self-service (Forrester, Oct 2025).
Does live chat increase sales?
The best evidence says yes, by mid-teens percentages, with two caveats: shoppers who start a chat were already more likely to buy, and studies measure different kinds of chat in different markets.
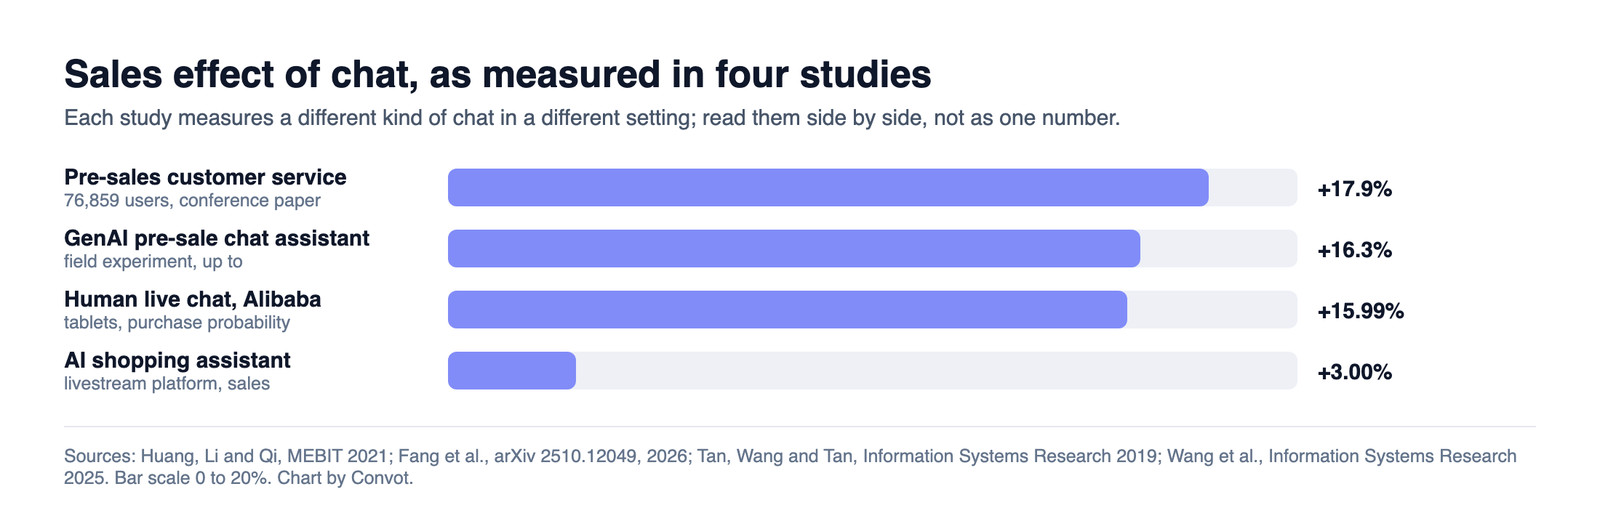 Figure 8: Three different study designs land in the mid-teens, which makes a meaningful sales lift from pre-sale chat more credible than any single headline number. Source: Tan, Wang and Tan, Information Systems Research, Dec 2019, with the other studies cited below. Chart by Convot from the cited studies, captured 3 Oct 2026.
What do field studies find?
Controlled and selection-corrected studies agree on a positive effect on purchases.
- Taobao sellers who use live chat see higher traffic-to-sales conversion, especially when product pages are less informative (Production and Operations Management, May 2021).
- A GenAI pre-sale chat assistant on a cross-border retail platform lifted sales by up to 16.3% in a randomized field experiment (Fang et al., arXiv, Jun 2026).
- An AI chat-based shopping assistant on a livestream selling platform raised sales by 3.00% and cut product return rates by 12.55% (Information Systems Research, Dec 2025).
- Using online pre-sales customer service raised purchase probability by 17.9% across 76,859 users after correcting for self-selection (MEBIT 2021 proceedings, Jun 2021).
- Shopify says customers who start a conversation through Shopify Inbox are 70% more likely to convert, a correlation rather than a measured lift (Shopify, Jul 2021).
Does live chat build trust?
Survey and lab studies link live chat to trust and purchase intention, mostly through a sense of human presence.
- Among 6,783 customers of five e-retailers, chat use strengthened the link between two-way communication and trust, satisfaction and repurchase intention (Electronic Markets, May 2018).
- In a survey of 631 travel consumers, a useful human live chat assistant increased trust in the website and purchase intention (International Journal of Contemporary Hospitality Management, May 2020).
- In an experiment with 93 participants, live chat raised social presence significantly, which in turn raised trust, though chat alone did not directly change purchase intent (ZHAW, Feb 2017).
- In scenario experiments, proactive chatbot responses raised purchase intention more than reactive ones (Behavioral Sciences, Feb 2025).
What does live chat software cost?
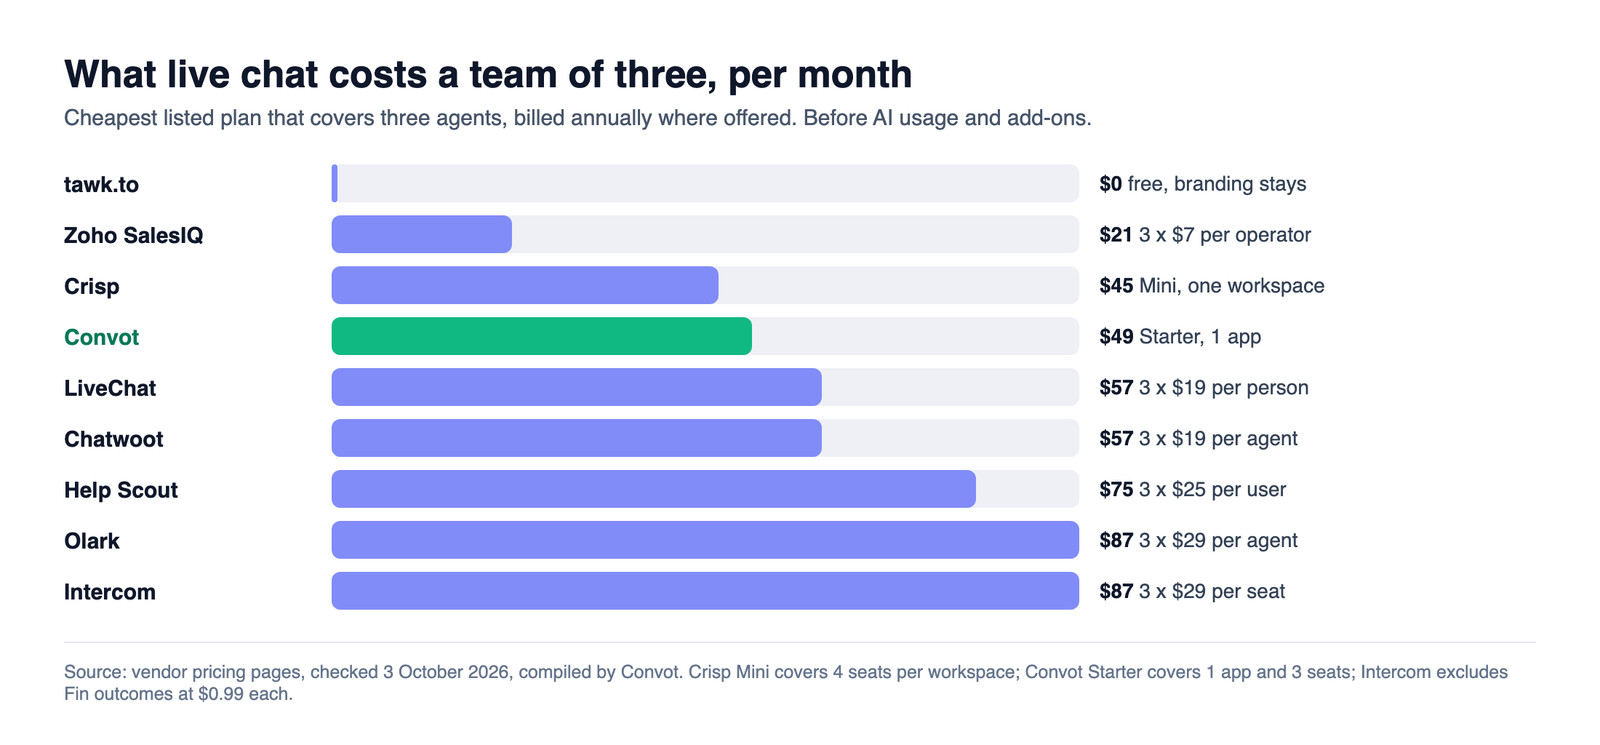
Live chat itself is cheap; the cost that grows is seats, AI usage and add-ons. Convot checked each tool’s own pricing page on 3 October 2026.
Figure 9: The cheapest paid option for three agents costs about a quarter of the dearest, and per-seat tools climb with every hire, so the right pick depends on how fast the team will grow. Source: Convot, Help desk pricing index, Oct 2026. Chart by Convot from vendor pricing pages, captured 3 Oct 2026.
What does each live chat tool charge?
Each price is the list price on the vendor’s own pricing page, checked on 3 October 2026.
- tawk.to is free, and removing its “Powered by tawk.to” branding costs $29 a month (tawk.to, Oct 2026).
- Zoho SalesIQ has a free plan, then $7, $12.75 and $20 per operator a month billed annually (Zoho, Oct 2026).
- Smartsupp has a free plan, then $17, $25 and $83 a month billed annually (Smartsupp, Oct 2026).
- LiveChat costs $19, $49 and $79 per person a month billed annually (LiveChat pricing, Oct 2026).
- Chatwoot is free for up to 2 agents, then $19, $39 and $99 per agent a month (Chatwoot, Oct 2026).
- Olark’s human-only live chat costs $29 per agent a month (Olark, Oct 2026).
- Crisp is free for 2 seats, and its Mini plan costs $45 a month per workspace with 4 seats (Crisp, Oct 2026).
- Help Scout includes live chat on every plan, from $25 per user a month billed annually (Help Scout, Oct 2026).
- Intercom costs from $29 per seat a month billed annually, with Fin AI Agent at $0.99 per outcome on top (Intercom, Oct 2026).
- Tidio starts at $24.17 a month billed annually for 100 billable conversations (Tidio, Oct 2026).
- Convot costs $49 a month for 1 app and 3 seats, with live chat, email and a help center, and is free for teams under $1,000 MRR (Convot pricing, Oct 2026).
Which is the cheapest live chat for a small team?
For three agents, the cheapest paid plans start around $21 a month.
- The cheapest paid live chat for three agents is Zoho SalesIQ at $21 a month billed annually, against $87 for Olark or Intercom (Convot, Oct 2026).
To compare full help desk bills, including AI and several products, use the help desk price calculator, or see the AI customer service statistics and the guide to adding live chat to a Shopify app.
Methodology and Sources
We included only statistics we could trace to the organisation that produced them: statistics offices, research firms publishing their own surveys, academic papers, and companies publishing data from their own platforms. We excluded numbers found only on statistics roundups, including several widely repeated live chat satisfaction figures we could not find at any original source. Each number was confirmed in the raw text of its source page in October 2026. Platform data from chat vendors such as LiveChat, Comm100, Freshworks and Tidio measures those vendors’ own customers and is labelled as such; the LiveChat report says its data was last updated in 2024, so we date it December 2024. Older studies, such as J.D. Power’s 2016 channel study and Gartner’s 2019 channel survey, are included only where nothing newer measures the same thing. Prices come from each vendor’s pricing page. We review every statistic monthly. You are welcome to cite any number on this page with a link back. For the wider picture, including an audit of the most-quoted figures, see the customer service statistics.
Sources
- Platform reports: LiveChat, Customer Service Report; Comm100, AI Live Chat Benchmark Report 2026; Comm100, live chat platform; Freshworks, Freshchat Benchmark Report; Freshworks, customer service statistics 2026; Tidio; Gorgias, Ecom Lab research; Shopify, Introducing Shopify Inbox
- Surveys and studies: SuperOffice, live chat support study; HubSpot, consumer live chat survey; YouGov; Five9; Genesys, State of CX; J.D. Power, 2016 Chat and Email Benchmarking Study; Qualtrics XM Institute; Zendesk CX Trends 2026; Salesforce, State of Service; Intercom, Customer Service Transformation Report; Forrester 2026 predictions
- Gartner: Live chat and self-service will surpass traditional channels, Aug 2025; Customers want access to a human, Aug 2026; Leaders under pressure to implement AI, Feb 2026; Self-service and channel preference, Sep 2019
- Statistics offices: Eurostat, ICT usage in enterprises (isoc_ciwebn2); Statistics Canada, AI use by businesses, Q2 2026; Statistics Canada, AI use by businesses, Q3 2025
- Academic research: Castellanos et al., Silent Abandonment in Text-Based Contact Centers; Daw et al., The Co-Production of Service; Goes, Ilk, Lin and Zhao, When More Is Less; Peng et al., AI Revolution on Chat Bot; Gupta et al., Building Customer Support AI Agents at 100M-User Scale; Tan, Wang and Tan, Impact of Live Chat on Purchase in Electronic Markets; Sun, Chen and Fan, Effect of Live Chat on Traffic-to-Sales Conversion; Fang et al., Generative AI and Sales Productivity; Wang et al., AI assistant in online shopping; Huang, Li and Qi, Online Pre-Sales Customer Service and Purchase Conversion; Mero, Two-way communication and chat service usage; McLean et al., Live chat assistants and travel consumers; Rawitzer, Seiler and Hari, Trust and e-commerce; Meng, Lu and Xu, Chatbot response strategies
- Pricing pages: tawk.to, Zoho SalesIQ, Smartsupp, LiveChat, Chatwoot, Olark, Crisp, Help Scout, Intercom, Tidio, Convot; Convot help desk pricing index
Revenue-aware support for Shopify app teams.
Live chat, help center, and every merchant's MRR, plan, and LTV beside the conversation. Free under $1k MRR.
Start free