Help Desk Reporting KPIs and Dashboards for Small Teams
Help desk reporting explained: which KPIs to track, where the data comes from, dashboard layouts, reporting cadence and common mistakes to avoid.
On this page
- What Help Desk Reporting Measures and Why It Matters
- The KPIs to Track First and What Each One Tells You
- Where Help Desk Data Comes From and How to Collect It
- Revenue and AI Signals to Add Beside Ticket Metrics
- Dashboard Layouts and a Reporting Cadence That Fits
- Common Reporting Mistakes and How to Fix Them
- Building These Reports in Convot, Step by Step
- Pick one KPI set and build it this week
- FAQ
Help desk reporting for a small team should track ten KPIs: first response time, resolution time, CSAT, first-contact resolution, backlog age, SLA compliance, ticket volume, revenue behind open tickets, escalation rate and reopen rate. Report medians and 90th percentiles, review a narrow panel daily and a wider one weekly, and set targets from four weeks of your own data.
Key takeaways
- Speed is two clocks. First response and resolution answer different questions; report both as median and 90th percentile.
- Quality needs strict definitions. Count first-contact resolution only with no second interaction, escalation or reopen.
- Revenue orders the queue, it doesn’t predict. Show the MRR behind each open ticket as history, not a forecast.
- AI replies need a stricter test than a closed conversation: on our own app, Cove handed 29% of 808 customer messages to a person in 30 days.
- Set targets from your own baseline, not an industry benchmark.
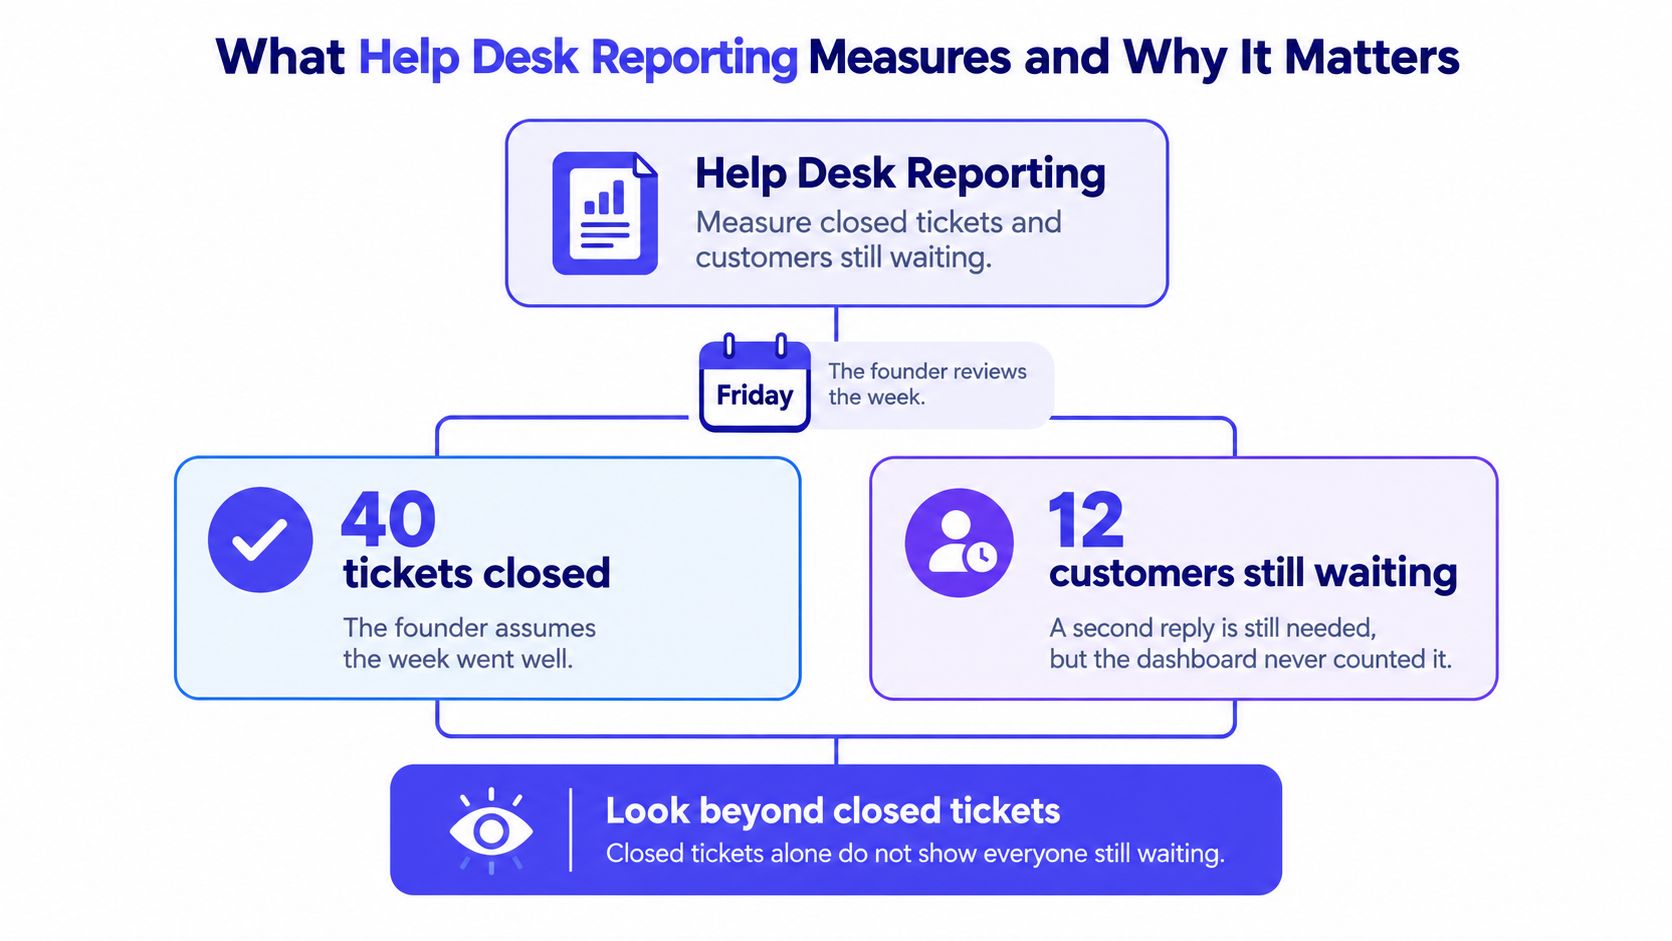
Friday reporting often ends with a closed count and a false sense of relief. A founder checks the inbox, sees work cleared, and moves on. Meanwhile, several customers still wait for the reply that decides whether the first answer helped at all. Good help desk reporting doesn’t celebrate activity. Good help desk reporting shows demand, delay, quality, and the money behind the queue, then forces one decision for the next week.
What Help Desk Reporting Measures and Why It Matters
Two weeks can post identical closed counts and have nothing in common. One week holds password resets and setup questions. The next holds a billing bug that reached annual subscribers days before renewal, with tickets marked solved coming back reopened. Help desk reporting is the regular measurement of how requests arrive, get answered, get solved, and pile up, compared against targets the team sets. A single headline number can’t carry that job.
Four Categories Beat One Closed Count
Sort your measures into four buckets: quantity, quality, timeliness, and compliance. Quantity counts new, resolved, assigned, and closed requests. Quality checks whether answers were accurate and whether they stayed closed.
Timeliness shows if high-priority work met its target. Compliance shows if the team followed the procedures and service levels it promised. Break each view down by priority, category, and escalation level, then add open volume and average age. That’s the point where a report starts helping with capacity planning instead of celebrating totals.
Closed tickets show work finished. Waiting customers show work customers still feel.
History Protects You From a Weird Month
One period misleads easily. A launch, outage, holiday, or staffing gap can make a healthy team look broken, or make a weak process look fine. Compare consistent intervals, and tie every KPI to a defined target, a named data source, and a collection method. If you can’t say where a number came from, it doesn’t belong on the dashboard.
A working report answers three questions in plain language:
- Demand: How much work is arriving, and from which app, channel, or category.
- Delay: Where time disappears between arrival, first reply, and resolution.
- Commitments: Whether customers got the response and resolution times you promised.
Queue-only reporting still misses two things. First, who is waiting. A trial question and a paying account’s billing error can sit in the same backlog with very different stakes. Second, whether automated answers held up. An AI reply that ends a conversation counts as a resolution only if the customer doesn’t return with the same problem. And keep what customers paid, your observed billing history, separate from anything you predict they’ll pay next.
Write one sentence that defines your own report. Then list which of the four categories it ignores today. That gap is your first fix, because good reporting exposes waiting, weak answers, and missed targets before customers have to point them out.
The KPIs to Track First and What Each One Tells You
A small software team should track ten KPIs, starting with the core five, define each one tightly, and resist adding more until those numbers reproduce cleanly. Speed matters, but speed without quality checks rewards fast, wrong replies. Volume matters, but volume without age and priority hides the queue that’s hurting customers.
| KPI | What It Tells You | How to Calculate | Target Source |
|---|---|---|---|
| First response time | How fast a customer hears back | Median and 90th percentile of time from ticket open to first reply | Your own four-week baseline |
| Resolution time | How long a problem stays open | Median time from open to solved status, with business hours and calendar hours kept apart | Your baseline by priority |
| CSAT | How satisfied customers are when a conversation closes | Average 1 to 5 survey score, shown beside survey response rate | Your own baseline after four weeks of surveys |
| First-contact resolution | Whether one interaction solved the issue | Tickets solved with no second interaction, escalation or reopen, divided by all closed tickets | Your baseline after the definition is fixed |
| Backlog | How much work is waiting and how old it is | Open tickets grouped into age buckets, reviewed daily | Your own maximum allowed age per bucket |
| SLA compliance | Whether promised response and resolution times were met | Share of tickets meeting the target for their priority | The targets you publish to customers |
| Ticket volume | Demand arriving per app, channel and category | New tickets per period, split by app and category | Trend against the previous four periods |
| MRR-related signal | How much recurring revenue sits behind open tickets | MRR of the account behind each open ticket, summed by queue | Not a target; used to order the queue |
| Escalation rate | How often work moves to a specialist or manager | Escalated tickets divided by all tickets | Your baseline, reviewed monthly |
| Reopen rate | Whether solutions held | Tickets reopened within 7 days divided by closed tickets | Your baseline, lower is better |
Read Speed as Two Separate Clocks
First response time and resolution time answer different questions. A fast acknowledgement doesn’t mean the problem is solved. Report the median and the 90th percentile beside any average, because averages hide the slow tail where complaints come from. Keep business hours and calendar hours apart or weekend tickets will distort every Monday review.
Quality Needs a Strict Definition
CSAT works as a 1 to 5 survey sent when a conversation closes. Always show the response rate beside the score. A low score from a handful of unhappy replies doesn’t describe the whole queue, and a high score from happy self-selection doesn’t either. A practical guide on how to improve customer satisfaction without gaming the survey helps keep that distinction clear.
First-contact resolution needs the strictest rule in the table. Count a ticket only when it’s solved without a second interaction, escalation, or reopen. Benchmarks vary because definitions vary: one vendor compilation lists single-interaction resolution at 54.3% and an aggregate first-contact resolution figure of 69%, without naming the underlying studies. Your own trend matters more than either figure, but only if the definition never drifts. For the formula, SQM’s dated phone benchmarks and how to count an AI-answered conversation, see first contact resolution: formula and benchmarks.
Backlog, SLA, and Revenue Order the Queue
Group backlog into age buckets, such as under 24 hours, 1 to 2 days, and over 48 hours. Review the oldest bucket daily. SLA compliance then shows whether each priority met its promised response and resolution target, not whether the team felt busy. Which plan includes SLA targets differs by vendor, and the help desk software features cost table shows where each one sits for a 3-agent team.
The MRR-related signal is simpler than it sounds. Show the recurring revenue behind the account that opened each ticket, then use that context to order work. Don’t turn it into a prediction. Escalation rate and reopen rate close the loop by showing whether answers needed rescue or failed after closing.
Set targets from four weeks of your own baseline, not from a generic industry figure. Fill the table for your team this week and mark every KPI you can’t calculate today.
Where Help Desk Data Comes From and How to Collect It
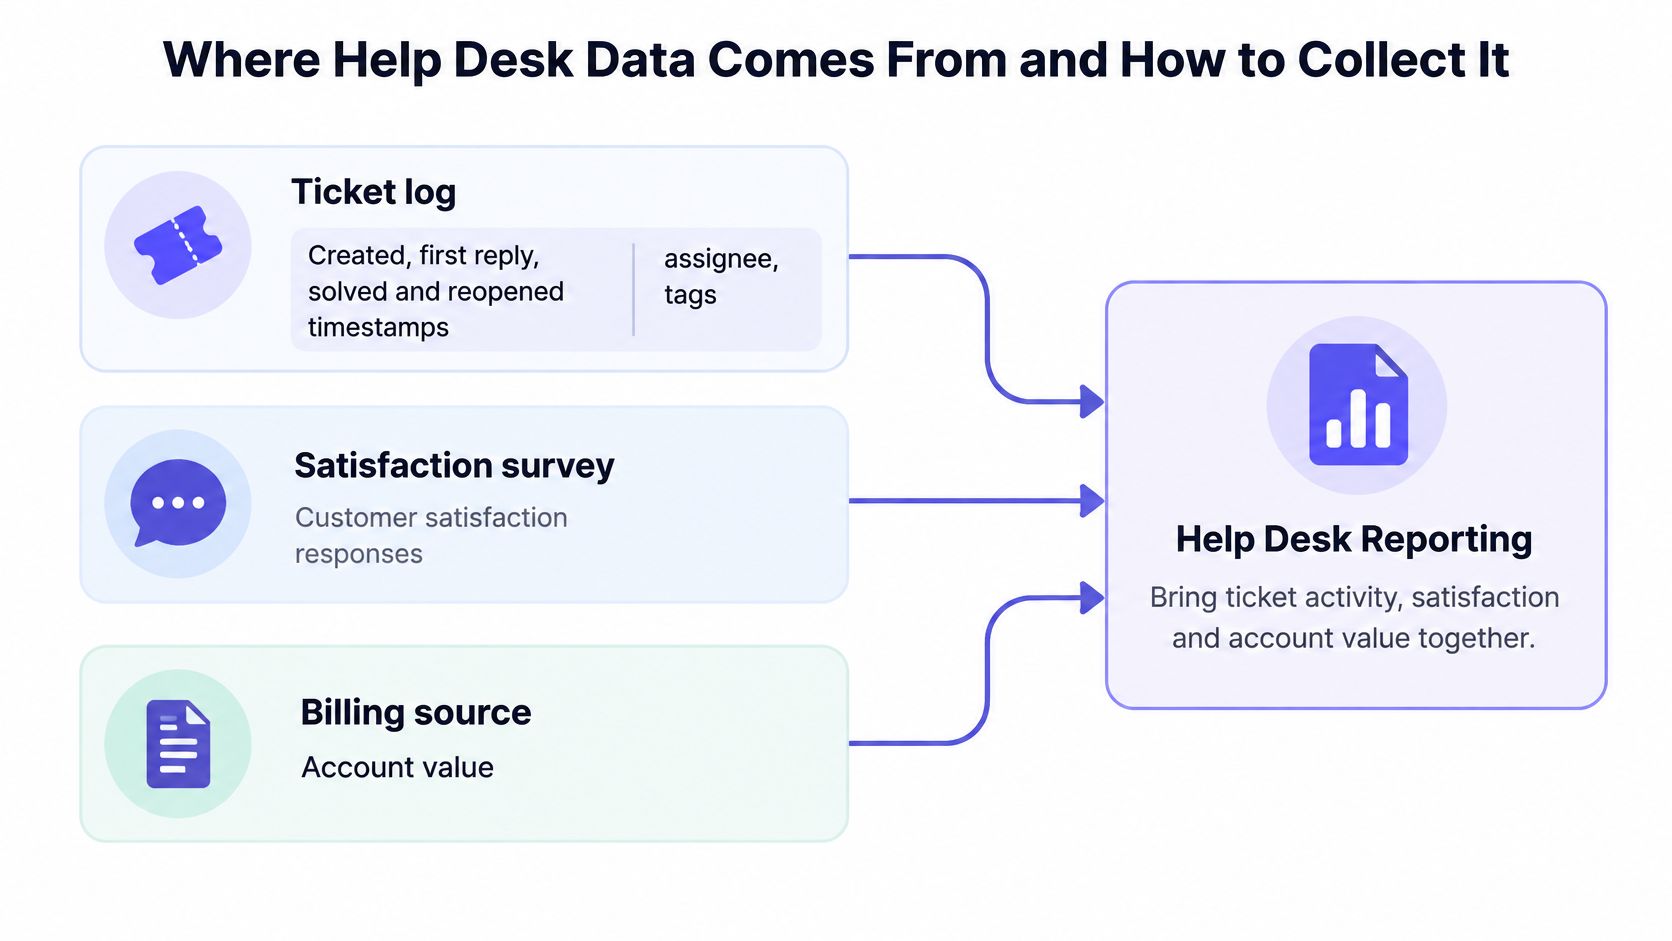
Help desk data comes from five sources, and a report fails when any source uses a different clock, customer ID, or tag name. The ticket log holds created, first reply, solved, and reopened timestamps, plus assignee and tags. The satisfaction survey holds the closing score. The billing source holds account value, the chat transcript holds AI replies, and the product log holds installs and errors.
Six Collection Steps
A boring collection flow beats a clever dashboard built on messy exports. Run the same steps each period:
- Export ticket events: Pull every timestamp, assignee, status change, reopen, and escalation so speed and quality use the same record.
- Tag from a fixed list: Use app, category, priority, and channel, with no more than 10 categories, so reports don’t split one issue into five names.
- Attach billing by customer ID: Match plan and billing status by stable ID, not email, because people change inboxes and share accounts.
- Survey at close: Send CSAT when the conversation closes and store the answer on the ticket itself.
- Calculate from written definitions: Use the same formula each period, even when the result looks worse than last month.
- Save weekly snapshots: Freeze each week’s numbers so later tag renames don’t rewrite history.
Practical rule: One KPI gets one source, one definition, and one named owner.
Traps That Quietly Break Reports
Business hours mixed with calendar hours is the classic trap. A ticket opened Friday night looks neglected by Monday even if nobody promised weekend cover. Pick one clock per SLA and label it on the panel.
Duplicate customers cause the second trap. One buyer appears under two accounts, volume splits, and revenue context lands on the wrong conversation. Stable customer IDs prevent that merge problem. Tag sprawl causes the third trap. Three labels for the same billing bug make a recurring defect look like three small annoyances, so nobody fixes the product.
Operational teams outside software hit the same problem. A workshop using repair work order software still needs one job record, one status history, and one owner before its reports mean anything. The tool differs. The data discipline doesn’t.
Shopify app teams should pull merchant plan and billing context from partner data and check it against the shop domain on the ticket. That prevents a test store or old install from carrying the wrong plan into the queue. Before connecting more sources, review your third-party integrations and the IDs each system sends so joins stay predictable.
Run a short checklist before the first report:
- Source named: Each KPI points to one export or system of record.
- Definition written: A new teammate can rebuild the number without asking.
- Owner assigned: One person answers when the number looks wrong.
Revenue and AI Signals to Add Beside Ticket Metrics
Ticket metrics alone reward speed and hide value, because a fast reply to the wrong queue still looks like progress. Revenue and AI signals fix that blind spot, but only when teams keep observed facts separate from guesses. Help desk reporting gets stronger when each conversation carries product, plan, outcome, and recontact context.
Revenue Context Orders Work
Useful revenue signals are plain historical facts:
- Account value: Recurring revenue behind the account that opened the conversation.
- Billing history: Past invoices, plan changes, and current plan.
- Lifecycle events: Installs, upgrades, and uninstalls already recorded.
- Load per account: Support volume relative to active accounts.
- Disproportionate help: High-value accounts receiving far more assistance than similar accounts.
Those numbers describe what already happened. They don’t predict who will leave. Treat billing history as context for priority and follow-up, not as a forecast. A clear explanation of why support is a revenue function for Shopify apps keeps that boundary intact.
Consider two tickets with the same setup question. One comes from an account paying 400 dollars a month that opened four tickets in one week. Another comes from a free-tier account asking once. The answer may be identical, but the queue order shouldn’t be. The first account may need a call, a product fix, or a clearer onboarding step. The second may need one good article link.
AI Replies Need a Stricter Test
Conventional dashboards count an AI reply as a resolution. That’s too generous. Count an AI outcome only when the answer is grounded, the customer accepts it, no repeat contact follows, and no human has to correct it later.
Track citation coverage, escalation rate to a human, recontact within 7 days, correction rate after human review, unresolved intents, and accuracy by language. Separate those views by intent and language. Aggregate accuracy hides weak performance in low-volume languages until angry customers surface it for you.
An AI reply isn’t a resolution until it holds up under recontact, correction, and escalation checks.
Here is what that panel looks like on real data. On Appointo, a Shopify app built by Sidepanda, the company behind Convot, Cove AI evaluated 808 customer messages in 230 conversations over the 30 days to 14 October 2026. It answered 16% directly, drafted a reply for the team to review on 55%, and handed 29% to a person because no answer met its confidence threshold. A dashboard that counted only “AI replied” would miss that the larger share of the work was drafts and handoffs, which is exactly what this panel is for.
| Cove AI outcome, Appointo, 30 days | Messages | Share |
|---|---|---|
| Answered directly | 129 | 16% |
| Drafted a reply for the team | 444 | 55% |
| Handed to a person (below confidence threshold) | 235 | 29% |
| Total evaluated | 808 | 100% |
Convot data, first-party, October 2026. Counts are per customer message, not per conversation; customer feedback on AI answers was too sparse (5 ratings) to report.
Cost needs the same honesty. Total cost equals the AI fee per completed outcome, plus human minutes on escalated tickets at loaded hourly cost, plus repeat-contact cost. A cheaper per-resolution price can still lose once review time and recontacts enter the math. Report savings and customer harm on the same panel, or automation will always look better than it is.
List which revenue and AI signals you can compute now. Then list which ones need a source you don’t have yet. Don’t fill missing data with a score.
Dashboard Layouts and a Reporting Cadence That Fits
A small team needs a dashboard cadence tied to decisions, not a wall of charts opened only when something breaks. Daily panels protect waiting customers. Weekly panels adjust queues and staffing. Monthly and quarterly panels turn recurring pain into documentation, product fixes, and budget choices.
| Cadence | Panels to Show | Decision It Supports | Owner |
|---|---|---|---|
| Daily | Open backlog count, tickets older than 48 hours, first replies due in the next two hours, frustrated or escalated conversations | Who needs help right now | Shift lead |
| Weekly | Volume by app and category, median and 90th percentile first response time, resolution time, CSAT, first-contact resolution, four-week comparison | Whether queues or staffing need changes this week | Support lead |
| Monthly | SLA compliance by priority, reopen rate, recurring issues, staffing hours against volume | Which documentation and process fixes to make | Founder or support manager |
| Quarterly | Cost per resolved conversation, product issues, trend lines across all KPIs | Roadmap and budget decisions | Founder |
| Event-based (peaks, launches, outages) | Peak volume against baseline, response and resolution time, staffing | Whether to add cover or pause a release | Whoever holds the on-call rota |
Layout Follows the Order of Decisions
Put demand and backlog on the top row. Put speed in the middle. Put quality at the bottom. A reader should see how much arrived, how long customers waited, and whether the answer worked, in that order.
Daily review stays narrow. Open backlog, tickets older than 48 hours, first replies due soon, and frustrated or escalated conversations tell the shift lead where to intervene before lunch. Weekly review widens the lens. Volume by app and category, response and resolution distributions, CSAT, and first-contact resolution show whether the queue design still fits demand.
Monthly review asks a harder question. SLA compliance by priority, reopen rate, recurring issues, and staffing hours against volume show which documentation gap or workflow keeps recreating tickets. Quarterly review connects cost per resolved conversation and recurring product issues to roadmap and budget decisions.
Every panel must name the decision it supports. Drop panels that support no decision, even when the chart looks impressive in a demo.
Peaks Need Their Own View
Annual averages hide the weeks when service quality is most at risk. A staffing firm’s compilation, attributing the figure to Zendesk’s 2025 benchmark data, reports that 71% of support organizations see at least one period a year above 150% of monthly baseline, and that Black Friday to Cyber Monday volume can reach 2.5 to 3.5 times baseline over about five days. Shopify app teams feel that spike through merchants, even when their own product didn’t change.
Build an event view for peaks, launches, and outages. Compare peak volume with baseline volume, response time, resolution time, and staffing on one page. Decide in advance who can add cover, pause a release, or extend hours.
Pick two cadences to start. Book the calendar reminders and assign one person to each panel before building anything fancy.
Common Reporting Mistakes and How to Fix Them
Reporting mistakes usually come from a clean-looking number hiding an ugly queue, a changed definition, or demand shown without capacity. Most fixes take a day or one definition change. A new tool rarely fixes a metric nobody defined.
| Symptom | Likely Cause | Fix |
|---|---|---|
| Median response time improves while customers still complain | Fast averages hide slow tails | Report the 90th percentile by priority and fix the slowest queue first |
| CSAT falls while speed improves | Agents close tickets before the problem is solved | Track reopen rate and require a solution note before closing |
| Backlog grows while volume stays flat | Tickets sit in the wrong queue or staffing hours changed | Check queue ownership and age buckets this week |
| AI resolution rate is high but recontacts rise | The AI answers without grounded sources | Tighten the source articles and lower the handoff threshold |
| First-contact resolution jumps after a tag change | The definition changed, not the work | Restate earlier months under the new definition |
| Monthly numbers swing sharply | Comparing unequal intervals or peak weeks | Compare the same interval length and show peak weeks separately |
Read Symptoms in Pairs
Median first response can improve while complaints rise. The likely cause is a slow tail buried under many easy tickets. Report the 90th percentile by priority and fix the slowest queue first, not the queue with the loudest internal advocate.
CSAT falling while speed improves points somewhere else. Agents may be closing tickets before the problem is solved. Pair CSAT with reopen rate and require a short solution note before closing. That one habit exposes premature closes within a week.
Backlog deserves special care on small teams. The same compilation, drawing on vendor and analyst reports it doesn’t tie to each figure, says ticket volume rose roughly 14% a year between 2023 and 2025 while support headcount grew about 6%, and only 32% of support teams consistently meet their own service-level targets. Treat those as directional. A backlog chart without incoming volume, staffing hours, first response, and SLA attainment can make a falling-behind team look stable.
AI and definition errors need restraint, not celebration. High AI resolution with rising recontacts means answers aren’t holding. A sudden first-contact jump after a tag change usually means the ruler changed. Restate earlier months under the new definition before claiming progress.
Run one test this week. Pick a number in your current report and rebuild it from the raw export using only its written definition. When the numbers don’t match, return to the collection checklist in the data section. The definition is the problem, not the data.
Building These Reports in Convot, Step by Step
Convot makes a competing help desk, so treat this as a worked example rather than an independent review. The setup below assumes a Shopify app team running three apps from one shared inbox, and every step keeps the same definitions, owners, and snapshots you would use in any other tool.
Setup Steps for a Three-App Team
Six steps get the reports running:
- Connect Shopify Partner data: Show each merchant’s plan, MRR, and billing history beside the conversation (how that works for Shopify app teams), so priority decisions use current account context.
- Keep one tag list per app: Use the same issue names across apps in the export, so recurring problems don’t split into three small categories.
- Check the weekly panel against an export: Use the reports in the product, then rebuild the core numbers from exported timestamps with the written definitions from the KPI section. A number you can rebuild is a number you can trust.
- Write articles for repeats: Turn repeated questions into help center articles. One help desk covers live chat, help center, changelog, scheduling, and a revenue dashboard, so each article does double duty.
- Review AI handoffs weekly: Cove AI answers from your help center articles, can show which article it used, and hands off when it is not sure. Count an AI reply as resolved only when the customer stays resolved. A handoff or a recontact on the same issue means the answer didn’t hold.
- Read revenue as history: The revenue view shows observed billing. Leave prediction out of it.
Cove AI answers from your published help center articles, so the same write-up answers customers in both the help center and the chat. That gives you a clean test. When an article improves, AI answers and human replies improve from the same source. When the article stays vague, handoffs and recontacts expose it.
Convot’s revenue dashboard covers MRR, net payout, total revenue, ARPU and LTV from your Shopify Partner data, alongside support. Use it to understand load and account context after the fact; it records what already happened and makes no predictions.
Alerts need the same discipline as panels. Convot routes alerts for new installs, upgrades, uninstalls, and frustrated merchants to the right Slack channel, per app. Send an alert only when a named person can act on it during the shift. An alert nobody owns is an unread report.
Build the report from timestamps and written definitions first. Product views should confirm the export, not replace the audit.
Migration Without Losing the Baseline
Switching help desks puts your trend lines at risk no matter which vendor you leave or join. Other tools may fit better for some teams. Zendesk can suit large regulated teams, Intercom can suit companies already built around its messenger, and Freshdesk can suit teams that want a familiar ticket workflow. Judge the move on whether your export and your written definitions survive it.
Export ticket history and CSAT first, with original timestamps, customer IDs, tags, and reopen events intact. Run old and new reports in parallel for two weeks and compare every core KPI before retiring the old report.
Differences will appear. Some come from business-hour settings, merged customers, or tag cleanup. Write down each one and decide whether to restate history or start a clean baseline. If you splice two definitions into one trend line, mark the break on the chart.
Pick one KPI set and build it this week
One KPI set built this week beats a perfect dashboard planned for next quarter. Start with the core five and stop there until each number reproduces from the same export twice in a row.
Follow these steps in one sitting:
- Pick the core five: First response time as median and 90th percentile, resolution time, backlog age, CSAT, and first-contact resolution.
- Write definitions: Give each KPI one line, one source, and one owner.
- Pull four weeks of history: Set baselines from your own team, because size, issue complexity, staffing, and support hours differ from any benchmark.
- Build the weekly panel: Show demand, speed, and quality on one page with a four-week comparison.
- Review for 30 minutes: Meet with one named owner and leave with one queue, documentation, or staffing decision.
Add revenue and AI signals only after the core numbers stay stable. When comparing tools, test whether each KPI can be calculated from the export. A polished demo proves nothing if timestamps, reopens, tags, or billing context can’t leave the product cleanly.
Paste one sentence into your team doc today: the definition of your first KPI and the name of the person who owns it. Help desk reporting starts there, not with another chart. For the metrics that matter most to app teams specifically, see customer support metrics for Shopify apps, and for grading AI answers, how to grade AI support quality.
FAQ
What KPIs should a small help desk track first?
A small help desk should start with five KPIs: first response time (median and 90th percentile), resolution time, backlog age, CSAT with its response rate, and first-contact resolution. Add SLA compliance, volume by app, revenue behind open tickets, escalation rate and reopen rate once those five reproduce cleanly.
How do you calculate first-contact resolution?
First-contact resolution is the share of closed tickets solved with no second interaction, no escalation and no reopen, divided by all closed tickets in the period. Keep the definition fixed, because changing it changes the number more than the work does.
How often should support reports be reviewed?
Support reports work best on a cadence tied to decisions: a narrow panel daily for the backlog, a weekly panel for queues and staffing, a monthly review for SLAs and recurring issues, and a quarterly review for cost per resolved conversation and roadmap.
How should AI replies be counted in help desk reports?
AI replies should count as resolved only when the answer is grounded, the customer accepts it, no repeat contact follows within about 7 days and no person has to correct it. Report AI answers, drafts and handoffs separately.
If you’re supporting several apps from one inbox and want tickets, help center articles, merchant billing context, and AI handoffs in one place, take a look at Convot’s plans. Bring your KPI definitions, test the export against them, and keep the tool only if the numbers match your own baseline.
Revenue-aware support for Shopify app teams.
Live chat, help center, and every merchant's MRR, plan, and LTV beside the conversation. Free under $1k MRR.
Start free